How Cann Tested Whether AppLovin's ROAS Was Real and Saved Half a Million in Wasted Spend
AppLovin was reporting 2-16x ROAS. Cann's growth team didn't buy it. BlueAlpha designed a geo holdout test that measured actual sales lift against a Bayesian counterfactual, and the result was zero measurable performance gain at current spend levels. That answer freed $40K/month for channels that actually convert.
Incrementality Proven
Channel Validated

“Every marketer I talk to is trying to figure out if AppLovin is legit or a black hole. We decided to stop guessing and actually test it. The data came back clear: at our spend levels, it wasn't driving any lift. That's not a failure. That's $480K a year we can now put into channels where we can prove the dollars work.”
“Every marketer I talk to is trying to figure out if AppLovin is legit or a black hole. We decided to stop guessing and actually test it. The data came back clear: at our spend levels, it wasn't driving any lift. That's not a failure. That's $480K a year we can now put into channels where we can prove the dollars work.”

Cole Singer, Vice President of Growth @ Cann
Who Is Cann and Why Were They Skeptical of AppLovin?
Cann makes cannabis-infused beverages sold direct-to-consumer through their Shopify store. Their marketing philosophy is performance-first and CAC-driven. They don't trust platform dashboards that can't be cross-referenced against real purchase data.
At the time of this test, Cann was running a variety of paid channels including Meta, Snap, and AppLovin. They were looking to scale their growth through paid acquisition but were skeptical of AppLovin's performance. Their monthly AppLovin spend was approximately $40K.
The core tension: AppLovin's dashboard was reporting wildly fluctuating ROAS (2-16x on any given day), and no one on the team could confidently say whether those numbers reflected real incremental revenue or attribution theater.
Is AppLovin's Reported ROAS Real?
No. At least not for Cann at ~$10K/week.
Cann's situation will sound familiar to anyone running AppLovin in a D2C media mix. The platform was reporting impressive return numbers. Some days it claimed 16x ROAS. Blended monthly figures ranged from 2-4x. On paper, it looked like a scaling opportunity.
The problem: nobody on the team trusted the numbers.
What made this particularly confusing was the divergence between data sources. In December, AppLovin's in-platform reporting showed a 1.25 ROAS. Triple Whale, which most brands lean on as a more neutral source of truth, was showing 4.77 for the same period — nearly four times higher. That kind of gap between in-platform and third-party attribution is rare, and it was exactly what made the channel look like a legitimate scaling opportunity on paper. When your attribution tool of record shows 4.77, the instinct is to push spend harder. The geo holdout test revealed why that instinct would have been expensive.
Beyond the discrepancy, Cann's audience on AppLovin had nearly zero overlap with Meta, which should have made it easier to isolate impact. And yet, the internal debate kept cycling through the same loop:
→ "That's a great ROAS. We should scale."
→ "Wait, those are modeled conversions. Are people really pausing Candy Crush to impulsively spend $100+ on a beverage they've never heard of before? It doesn't seem like real consumer behavior."
→ "Well, we have no causal proof either way. We're just arguing from priors."
When Cole Singer joined Cann as VP of Growth, his first move was to pull all AppLovin spend. The team later saw signs that maybe the channel was contributing something, so they turned it back on. That back-and-forth is the exact failure mode that a structured geo holdout test is designed to break.
The core question was simple: At ~$10K/week in AppLovin spend, is any of that money producing sales that would not have happened otherwise?
How Did BlueAlpha Test AppLovin's Real Performance?
BlueAlpha designed a geo holdout test to isolate AppLovin's causal contribution to Cann's revenue. The design was deliberately conservative: if AppLovin was truly driving lift, even a modest test should pick up a signal.
Test Design
Parameter | Setting |
|---|---|
Test type | Geo holdout (exposed vs. synthetic control) |
Holdout states (AppLovin OFF) | Florida, Illinois, Massachusetts, New York, Texas |
Treatment states (AppLovin ON) | All other eligible states |
Weekly budget | ~$10K/week |
Test duration | 19 days (Jan 13-31, 2026) |
Primary metrics | Gross Sales, Gross Orders (measured via Shopify) |
Model | BSTS (Bayesian Structural Time Series) with synthetic control |
Statistical targets | α = 0.05, 95% credible interval |
Data source | Shopify (not in-platform reporting) |
Why This Design
The holdout states (FL, IL, MA, NY, TX) were chosen due to their size and significance in Cann's market. By turning AppLovin off in these states while keeping it running everywhere else, BlueAlpha constructed a natural experiment: if AppLovin is driving real sales, the treatment states should outperform the counterfactual prediction based on the holdout states.
A critical design choice: measuring against Shopify data, not AppLovin's own dashboard — and not Triple Whale's modeled attribution. Platform-reported conversions are modeled estimates. Third-party attribution tools apply their own modeling logic on top of that. Shopify sales are actual transactions. This distinction is the difference between asking AppLovin "did you work?" and checking the cash register.
How Does a Geo Holdout Test Actually Work? (Methodology)
A geo holdout test answers the question every brand asks about a paid channel: "What would our sales have looked like if we hadn't spent this money?" Because you can't observe both realities at once, the test constructs a statistical estimate of the world where the spend didn't happen. That estimate is called a counterfactual.
The synthetic control approach. Rather than comparing treatment states to a single control state (which introduces too much noise), BlueAlpha's model builds a weighted blend of the holdout states to approximate what the treatment states' sales trajectory would have been without AppLovin. For example, the counterfactual for one state might be estimated as 0.40 × Florida + 0.35 × New York + 0.25 × Massachusetts. The model learns these weights from the pre-period (the weeks before the test starts) when all states were in the same condition.
The model: BSTS (Bayesian Structural Time Series). The underlying statistical engine is a Bayesian model that separates the treatment state's sales signal into two components: a local trend (capturing drift not explained by the controls) and a regression on control states (the weighted combination of holdout regions). Because it's Bayesian, it produces a full distribution of plausible outcomes rather than a single number, which is why the results include credible intervals instead of just point estimates.
Control selection. The model uses a spike-and-slab prior to automatically determine which control states are informative and which are noise. This prevents overfitting by expecting roughly three useful controls even when many candidate states are available. The selected controls are then refitted for the final posterior estimate.
Significance rule. After the test period, the model computes a 95% credible interval for the cumulative sales effect. If the entire interval is above zero, the lift is significant. If the interval is below zero, the channel is destroying value. If the interval spans zero (as it did for Cann), the measured effect is not statistically distinguishable from no impact.
This approach is more rigorous than multi-touch attribution (MTA), which relies on click-path modeling and cannot separate correlation from causation. It is also more precise for single-channel questions than marketing mix modeling (MMM), which estimates all channels simultaneously but requires longer time series and larger spend variation to produce tight estimates for any individual channel.
Did AppLovin Drive Any Measurable Sales Lift for Cann?
No. The test detected zero statistically significant lift.
Key Finding (Gross Sales)
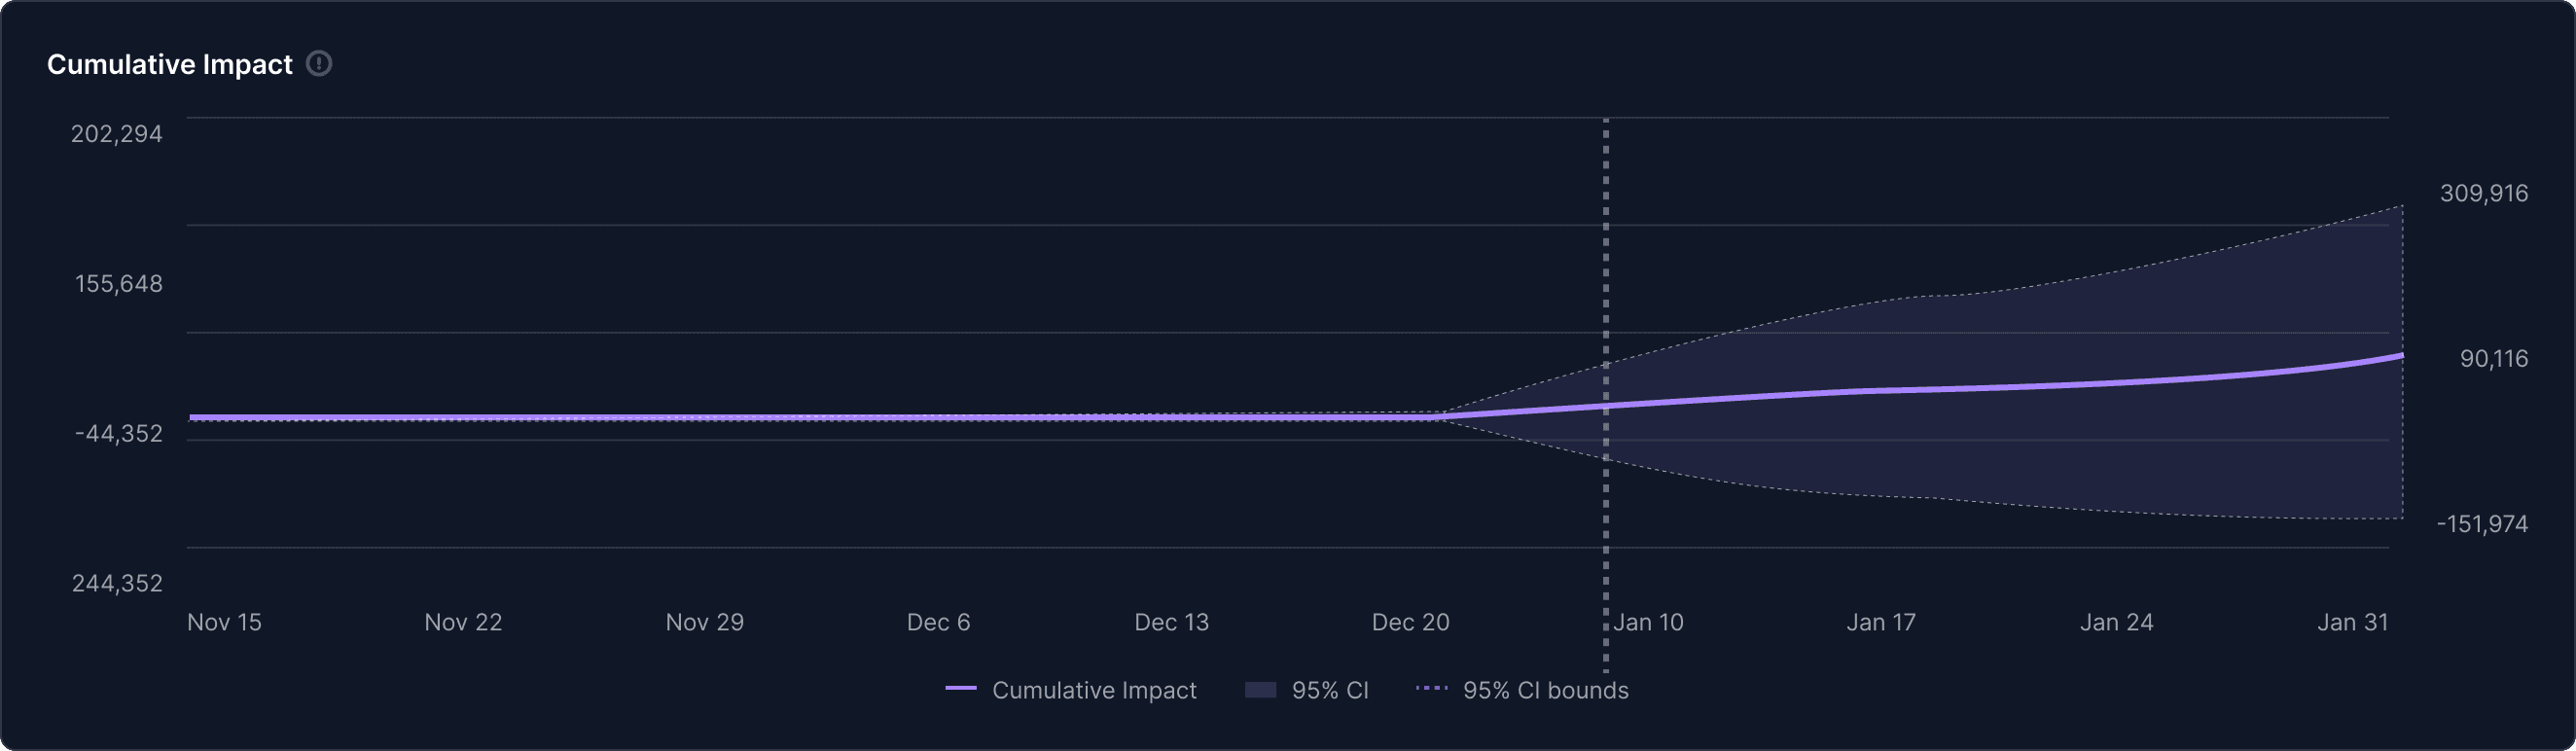
Estimated incremental Gross Sales: +$90K
95% Credible Interval: [-$152K, +$310K]
Interpretation: The credible interval includes zero, which means the measured effect is not statistically distinguishable from no impact at all
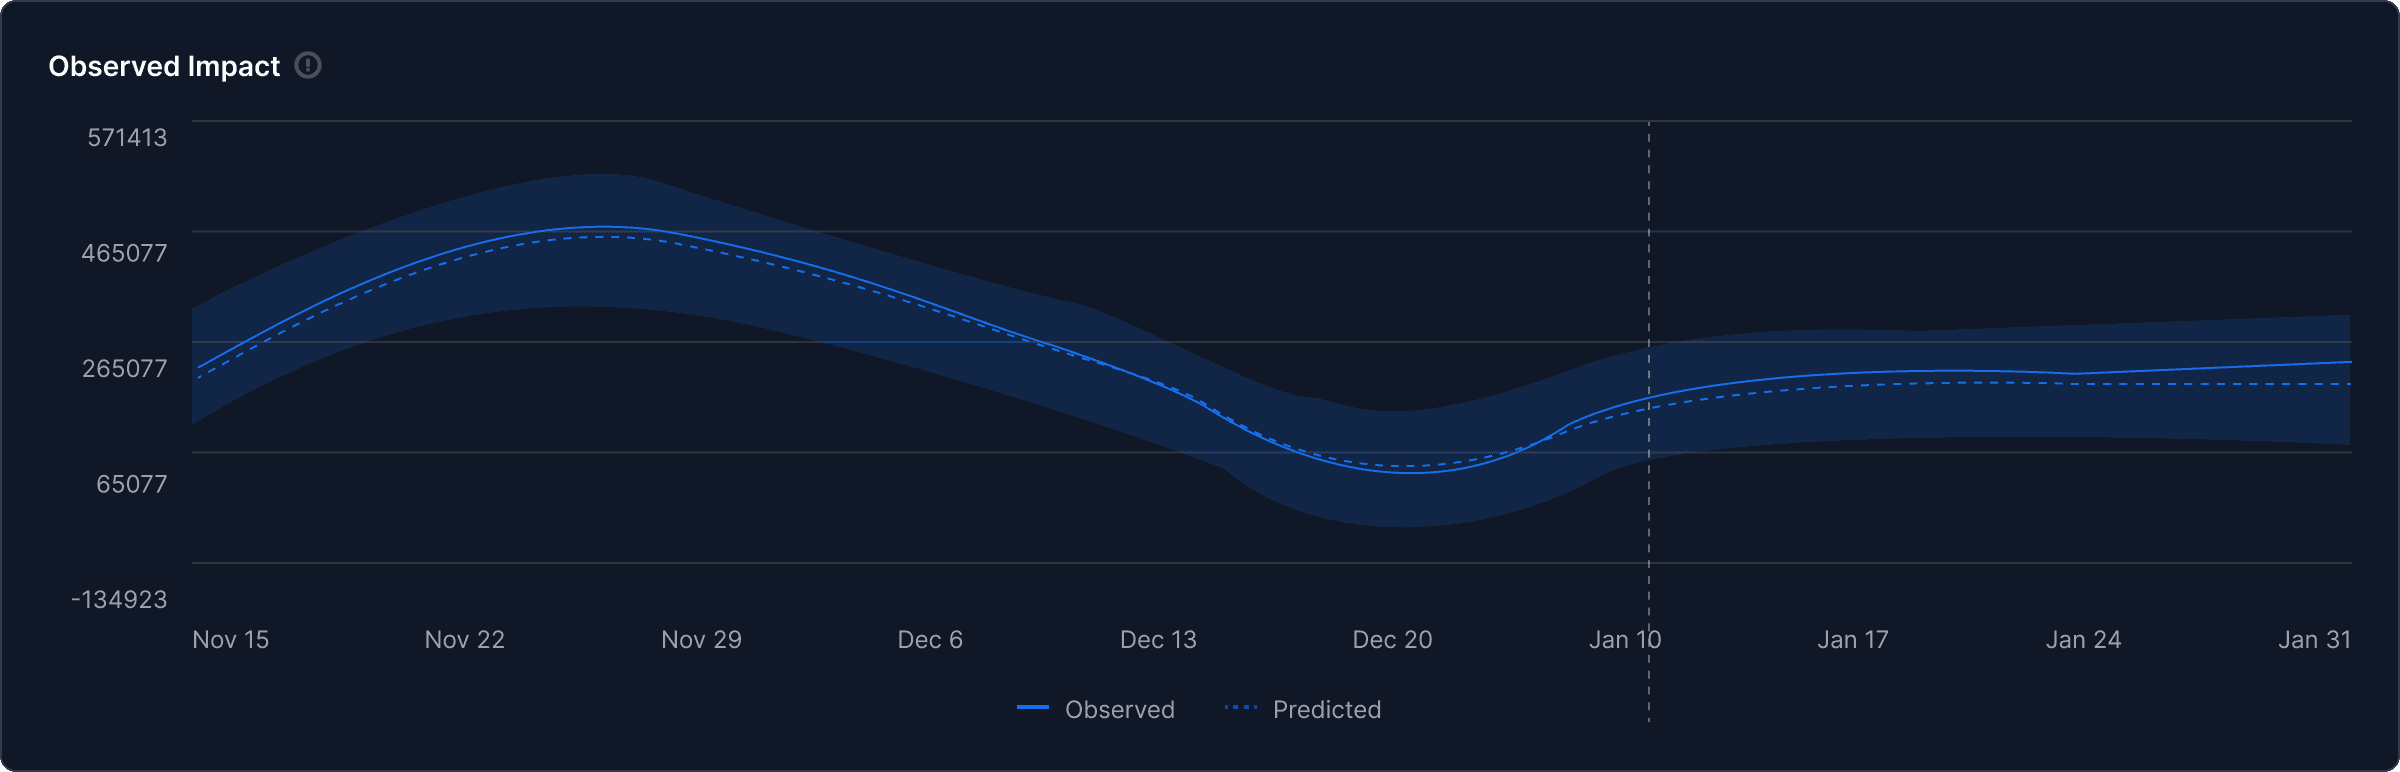
What This Means in Plain Language
When AppLovin was turned off in five major states, nothing happened. Sales in the holdout states tracked exactly where the model predicted they would be. There was no dip. There was no measurable loss.
The cumulative impact chart tells the same story: the point estimate trends slightly positive, but the uncertainty band spans from negative to positive values. That is not a signal. That is noise.
Platform Performance (For Context)
While the geo holdout showed no real-world lift, the platform itself was technically "performing" by its own metrics:
Metric | Value |
|---|---|
Platform CPA (checkout) | ~$500 |
ROAS (platform-reported) | 0.43x |
Avg CTR | 5.6% |
Avg CPC | ~$0.6 |
Avg CPM | ~$35 |
The disconnect is instructive. AppLovin reported a ROAS of 0.43x during the test window. By the platform's own numbers, this already isn't a compelling return. But the geo holdout showed something worse: even those conversions may not be incremental. The people who checked out likely would have purchased anyway through other channels or organic behavior.
This also puts the December Triple Whale discrepancy in sharper relief. A 4.77 ROAS in Triple Whale looked like a compelling reason to stay in the channel. The geo holdout confirmed it wasn't measuring what the team thought it was measuring.
Why Did Other AppLovin Tests Show Positive Results?
This is the right question to ask, and the answer matters for how you interpret any single study, including this one.
Several measurement providers have published AppLovin results that paint a more optimistic picture. Here is how those results compare to Cann's, and what the differences reveal about test design and interpretation.
Haus tested four brands and found positive lift in all four cases. Twillory, Flux Footwear, Jones Road Beauty, and Fresh Clean Threads all showed incremental contribution from AppLovin when measured via Haus's geo holdout methodology. The incrementality factor for Twillory was 1.69x what the platform reported. These are credible results from a credible measurement partner.
Three things are worth noting when comparing those results to Cann's:
First, spend levels varied significantly. Twillory was spending the least of the four Haus brands and saw the highest efficiency. Jones Road Beauty was spending approximately $60K/week and, while it did show incremental lift to total orders, the cost per incremental acquisition was significantly above their target. Positive lift and positive ROI are not the same thing. Cann was spending $10K/week. Spend level is the single biggest variable that changes incrementality outcomes. At lower spend, you are reaching a narrower slice of inventory and audience, and the marginal return of each dollar is different than at $60K/week.
Second, the Haus study did not publish confidence intervals or posterior distributions for individual brand results. The tests are described as showing "significant," "medium," or "small" lift, but the statistical precision of each estimate is not disclosed in the public case study. BlueAlpha's test for Cann showed a point estimate of +$90K, which sounds positive in isolation. The credible interval of [-$152K, +$310K] is what reveals the estimate is indistinguishable from zero. Without intervals, a point estimate can tell any story you want.
Third, Jones Road Beauty's result is actually instructive for Cann. Jones Road saw a small lift on new orders but a strong lift on returning customer orders. AppLovin doesn't currently let brands exclude existing customers, which means the channel may be more effective at reactivating lapsed buyers than at acquiring genuinely new ones. For Cann, a cannabis beverage brand with a very different repeat purchase profile than beauty, this dynamic may not apply.
Northbeam reported that AppLovin's ROAS was 45% higher than Meta across their user base. This finding comes from a different measurement methodology entirely. Northbeam uses multi-touch attribution (MTA), which is a click-path model that assigns fractional credit to touchpoints along a user's conversion journey. MTA can tell you which ads a user interacted with before purchasing. It cannot tell you whether that user would have purchased anyway without seeing the ad. That is a fundamentally different question than what a geo holdout answers.
Northbeam's data also showed that 85% of AppLovin purchases came from new customers, which is a strong signal. But MTA-based "new customer" classification depends on Northbeam's identity resolution. If a user is already in the funnel from a Meta ad and then clicks an AppLovin ad before purchasing, MTA can credit AppLovin with that new customer acquisition even though Meta did the demand generation.
This is not a criticism of Northbeam's methodology for its intended use case. MTA is valuable for day-to-day optimization and media mix allocation at the platform level. It is not designed to answer the causal question: "What would have happened if we turned this channel off?" The Triple Whale discrepancy Cann observed in December — 4.77 vs. 1.25 in-platform — is a variation of the same problem: attribution models can amplify a signal that a causal test reveals to be noise.
Common Thread Collective (CTC) reported on their D2C Hotline podcast that every AppLovin incrementality test they ran came back positively incremental. CTC's team also recommended that brands commit to AppLovin as a long-term channel, targeting 10-15% of total media mix by mid-2026. To our knowledge, CTC did not publish the test designs, confidence intervals, holdout structures, or brand names associated with those tests. That makes the claim difficult to evaluate independently.
The bottom line: AppLovin may well be incremental for many brands. What this case study demonstrates is that at $10K/week for a cannabis beverage D2C brand, the channel did not produce measurable lift when tested with a rigorous causal design. Spend level, product category, creative strategy, and audience profile all matter. The only way to know is to test for your own business.
What Should You Do If AppLovin Isn't Delivering Real Performance?
Based on the test results, Cann made an immediate decision: pause AppLovin and reallocate the $40K/month into Google, which was already showing promise as a scaling channel. Meta spend was left untouched because it was performing well.
Cole's framing captured the strategic value clearly: even if the reallocated budget broke even elsewhere, the outcome would be identical to what AppLovin was delivering. The floor was zero, and everything above it was pure upside.
Decision Framework
Option | Action | Rationale |
|---|---|---|
Chosen: Pause + Reallocate | Kill AppLovin spend, shift $40K/month to Google | No lift detected; budget better deployed elsewhere |
Alternative: Rerun at Higher Spend | 2-3x budget, expanded holdout, 4-6+ week test | Would only make sense if there were strategic reasons to believe a higher spend threshold would unlock performance |
Future: Test Other Channels | Run the same holdout playbook on Meta and TikTok | Establish baselines across the full media mix |
What Every D2C Brand Should Take Away from This Test
Platform ROAS is not real-world performance. AppLovin was reporting returns that looked attractive on a dashboard. The geo holdout showed those returns did not correspond to revenue that would disappear without the spend. The platform was likely taking credit for conversions that would have happened through other channels or organically.
Third-party attribution tools can compound the problem, not just solve it. The 4.77 Triple Whale ROAS in December looked more credible than the in-platform number precisely because it came from an independent source. The geo holdout test showed that both were wrong in the same direction. Attribution modeling (whether from the platform itself or a third party) cannot answer the causal question. A holdout test can.
Geo holdout tests are the fastest way to cut through attribution noise. This test took 19 days and cost ~$30K in media spend. The answer it produced: don't spend $480K+ this year on a channel that isn't pulling its weight. The ROI on the test itself is extraordinary.
Skepticism is warranted, but testable. Half the D2C community swears by AppLovin; the other half calls it a scam. The productive move is neither: it's designing a test that produces a definitive answer for your specific business, at your specific spend levels.
Lack of geographic reporting is a red flag. Unlike other ad platforms, AppLovin cannot break down delivery by State or DMA in their reporting (only Country level is available), which makes it functionally impossible for advertisers to audit targeting accuracy. That should factor into trust assessments.
Results are spend-level-specific. This test proved AppLovin was not driving measurable lift at $10K/week for Cann. A different brand with different scale, creative, and audience might see a different result. That's exactly why you test rather than assume.
Methodology matters at least as much as the conclusion. MTA, geo holdouts, and platform-reported ROAS will often give three different answers to the same question. The right comparison is not which number is biggest. It's which methodology answers the question you're actually asking: did this spend cause revenue that wouldn't have existed without it?
What This Test Cost vs. What It Saved
This test took 19 days and ~$30K in media spend to execute. The answer it produced redirects $480,000/year in ad budget away from a channel that was not delivering measurable lift and into channels where performance can be validated.
The ROI on the test: 16.7x in year one.
BlueAlpha runs geo holdout tests using Bayesian Structural Time Series models with synthetic controls, the same causal inference methodology used in academic research and by the largest measurement teams in tech. If you're spending $20K+/month on any channel and can't prove it's driving real sales, you have the same question Cann had. The difference is whether you answer it with data or keep debating it in Slack.
Get this case study as a PDF
Get this case study as a PDF
“Every marketer I talk to is trying to figure out if AppLovin is legit or a black hole. We decided to stop guessing and actually test it. The data came back clear: at our spend levels, it wasn't driving any lift. That's not a failure. That's $480K a year we can now put into channels where we can prove the dollars work.”
Cole Singer, Vice President of Growth @ Cann
Who Is Cann and Why Were They Skeptical of AppLovin?
Cann makes cannabis-infused beverages sold direct-to-consumer through their Shopify store. Their marketing philosophy is performance-first and CAC-driven. They don't trust platform dashboards that can't be cross-referenced against real purchase data.
At the time of this test, Cann was running a variety of paid channels including Meta, Snap, and AppLovin. They were looking to scale their growth through paid acquisition but were skeptical of AppLovin's performance. Their monthly AppLovin spend was approximately $40K.
The core tension: AppLovin's dashboard was reporting wildly fluctuating ROAS (2-16x on any given day), and no one on the team could confidently say whether those numbers reflected real incremental revenue or attribution theater.
Is AppLovin's Reported ROAS Real?
No. At least not for Cann at ~$10K/week.
Cann's situation will sound familiar to anyone running AppLovin in a D2C media mix. The platform was reporting impressive return numbers. Some days it claimed 16x ROAS. Blended monthly figures ranged from 2-4x. On paper, it looked like a scaling opportunity.
The problem: nobody on the team trusted the numbers.
What made this particularly confusing was the divergence between data sources. In December, AppLovin's in-platform reporting showed a 1.25 ROAS. Triple Whale, which most brands lean on as a more neutral source of truth, was showing 4.77 for the same period — nearly four times higher. That kind of gap between in-platform and third-party attribution is rare, and it was exactly what made the channel look like a legitimate scaling opportunity on paper. When your attribution tool of record shows 4.77, the instinct is to push spend harder. The geo holdout test revealed why that instinct would have been expensive.
Beyond the discrepancy, Cann's audience on AppLovin had nearly zero overlap with Meta, which should have made it easier to isolate impact. And yet, the internal debate kept cycling through the same loop:
→ "That's a great ROAS. We should scale."
→ "Wait, those are modeled conversions. Are people really pausing Candy Crush to impulsively spend $100+ on a beverage they've never heard of before? It doesn't seem like real consumer behavior."
→ "Well, we have no causal proof either way. We're just arguing from priors."
When Cole Singer joined Cann as VP of Growth, his first move was to pull all AppLovin spend. The team later saw signs that maybe the channel was contributing something, so they turned it back on. That back-and-forth is the exact failure mode that a structured geo holdout test is designed to break.
The core question was simple: At ~$10K/week in AppLovin spend, is any of that money producing sales that would not have happened otherwise?
How Did BlueAlpha Test AppLovin's Real Performance?
BlueAlpha designed a geo holdout test to isolate AppLovin's causal contribution to Cann's revenue. The design was deliberately conservative: if AppLovin was truly driving lift, even a modest test should pick up a signal.
Test Design
Parameter | Setting |
|---|---|
Test type | Geo holdout (exposed vs. synthetic control) |
Holdout states (AppLovin OFF) | Florida, Illinois, Massachusetts, New York, Texas |
Treatment states (AppLovin ON) | All other eligible states |
Weekly budget | ~$10K/week |
Test duration | 19 days (Jan 13-31, 2026) |
Primary metrics | Gross Sales, Gross Orders (measured via Shopify) |
Model | BSTS (Bayesian Structural Time Series) with synthetic control |
Statistical targets | α = 0.05, 95% credible interval |
Data source | Shopify (not in-platform reporting) |
Why This Design
The holdout states (FL, IL, MA, NY, TX) were chosen due to their size and significance in Cann's market. By turning AppLovin off in these states while keeping it running everywhere else, BlueAlpha constructed a natural experiment: if AppLovin is driving real sales, the treatment states should outperform the counterfactual prediction based on the holdout states.
A critical design choice: measuring against Shopify data, not AppLovin's own dashboard — and not Triple Whale's modeled attribution. Platform-reported conversions are modeled estimates. Third-party attribution tools apply their own modeling logic on top of that. Shopify sales are actual transactions. This distinction is the difference between asking AppLovin "did you work?" and checking the cash register.
How Does a Geo Holdout Test Actually Work? (Methodology)
A geo holdout test answers the question every brand asks about a paid channel: "What would our sales have looked like if we hadn't spent this money?" Because you can't observe both realities at once, the test constructs a statistical estimate of the world where the spend didn't happen. That estimate is called a counterfactual.
The synthetic control approach. Rather than comparing treatment states to a single control state (which introduces too much noise), BlueAlpha's model builds a weighted blend of the holdout states to approximate what the treatment states' sales trajectory would have been without AppLovin. For example, the counterfactual for one state might be estimated as 0.40 × Florida + 0.35 × New York + 0.25 × Massachusetts. The model learns these weights from the pre-period (the weeks before the test starts) when all states were in the same condition.
The model: BSTS (Bayesian Structural Time Series). The underlying statistical engine is a Bayesian model that separates the treatment state's sales signal into two components: a local trend (capturing drift not explained by the controls) and a regression on control states (the weighted combination of holdout regions). Because it's Bayesian, it produces a full distribution of plausible outcomes rather than a single number, which is why the results include credible intervals instead of just point estimates.
Control selection. The model uses a spike-and-slab prior to automatically determine which control states are informative and which are noise. This prevents overfitting by expecting roughly three useful controls even when many candidate states are available. The selected controls are then refitted for the final posterior estimate.
Significance rule. After the test period, the model computes a 95% credible interval for the cumulative sales effect. If the entire interval is above zero, the lift is significant. If the interval is below zero, the channel is destroying value. If the interval spans zero (as it did for Cann), the measured effect is not statistically distinguishable from no impact.
This approach is more rigorous than multi-touch attribution (MTA), which relies on click-path modeling and cannot separate correlation from causation. It is also more precise for single-channel questions than marketing mix modeling (MMM), which estimates all channels simultaneously but requires longer time series and larger spend variation to produce tight estimates for any individual channel.
Did AppLovin Drive Any Measurable Sales Lift for Cann?
No. The test detected zero statistically significant lift.
Key Finding (Gross Sales)
Estimated incremental Gross Sales: +$90K
95% Credible Interval: [-$152K, +$310K]
Interpretation: The credible interval includes zero, which means the measured effect is not statistically distinguishable from no impact at all
What This Means in Plain Language
When AppLovin was turned off in five major states, nothing happened. Sales in the holdout states tracked exactly where the model predicted they would be. There was no dip. There was no measurable loss.
The cumulative impact chart tells the same story: the point estimate trends slightly positive, but the uncertainty band spans from negative to positive values. That is not a signal. That is noise.
Platform Performance (For Context)
While the geo holdout showed no real-world lift, the platform itself was technically "performing" by its own metrics:
Metric | Value |
|---|---|
Platform CPA (checkout) | ~$500 |
ROAS (platform-reported) | 0.43x |
Avg CTR | 5.6% |
Avg CPC | ~$0.6 |
Avg CPM | ~$35 |
The disconnect is instructive. AppLovin reported a ROAS of 0.43x during the test window. By the platform's own numbers, this already isn't a compelling return. But the geo holdout showed something worse: even those conversions may not be incremental. The people who checked out likely would have purchased anyway through other channels or organic behavior.
This also puts the December Triple Whale discrepancy in sharper relief. A 4.77 ROAS in Triple Whale looked like a compelling reason to stay in the channel. The geo holdout confirmed it wasn't measuring what the team thought it was measuring.
Why Did Other AppLovin Tests Show Positive Results?
This is the right question to ask, and the answer matters for how you interpret any single study, including this one.
Several measurement providers have published AppLovin results that paint a more optimistic picture. Here is how those results compare to Cann's, and what the differences reveal about test design and interpretation.
Haus tested four brands and found positive lift in all four cases. Twillory, Flux Footwear, Jones Road Beauty, and Fresh Clean Threads all showed incremental contribution from AppLovin when measured via Haus's geo holdout methodology. The incrementality factor for Twillory was 1.69x what the platform reported. These are credible results from a credible measurement partner.
Three things are worth noting when comparing those results to Cann's:
First, spend levels varied significantly. Twillory was spending the least of the four Haus brands and saw the highest efficiency. Jones Road Beauty was spending approximately $60K/week and, while it did show incremental lift to total orders, the cost per incremental acquisition was significantly above their target. Positive lift and positive ROI are not the same thing. Cann was spending $10K/week. Spend level is the single biggest variable that changes incrementality outcomes. At lower spend, you are reaching a narrower slice of inventory and audience, and the marginal return of each dollar is different than at $60K/week.
Second, the Haus study did not publish confidence intervals or posterior distributions for individual brand results. The tests are described as showing "significant," "medium," or "small" lift, but the statistical precision of each estimate is not disclosed in the public case study. BlueAlpha's test for Cann showed a point estimate of +$90K, which sounds positive in isolation. The credible interval of [-$152K, +$310K] is what reveals the estimate is indistinguishable from zero. Without intervals, a point estimate can tell any story you want.
Third, Jones Road Beauty's result is actually instructive for Cann. Jones Road saw a small lift on new orders but a strong lift on returning customer orders. AppLovin doesn't currently let brands exclude existing customers, which means the channel may be more effective at reactivating lapsed buyers than at acquiring genuinely new ones. For Cann, a cannabis beverage brand with a very different repeat purchase profile than beauty, this dynamic may not apply.
Northbeam reported that AppLovin's ROAS was 45% higher than Meta across their user base. This finding comes from a different measurement methodology entirely. Northbeam uses multi-touch attribution (MTA), which is a click-path model that assigns fractional credit to touchpoints along a user's conversion journey. MTA can tell you which ads a user interacted with before purchasing. It cannot tell you whether that user would have purchased anyway without seeing the ad. That is a fundamentally different question than what a geo holdout answers.
Northbeam's data also showed that 85% of AppLovin purchases came from new customers, which is a strong signal. But MTA-based "new customer" classification depends on Northbeam's identity resolution. If a user is already in the funnel from a Meta ad and then clicks an AppLovin ad before purchasing, MTA can credit AppLovin with that new customer acquisition even though Meta did the demand generation.
This is not a criticism of Northbeam's methodology for its intended use case. MTA is valuable for day-to-day optimization and media mix allocation at the platform level. It is not designed to answer the causal question: "What would have happened if we turned this channel off?" The Triple Whale discrepancy Cann observed in December — 4.77 vs. 1.25 in-platform — is a variation of the same problem: attribution models can amplify a signal that a causal test reveals to be noise.
Common Thread Collective (CTC) reported on their D2C Hotline podcast that every AppLovin incrementality test they ran came back positively incremental. CTC's team also recommended that brands commit to AppLovin as a long-term channel, targeting 10-15% of total media mix by mid-2026. To our knowledge, CTC did not publish the test designs, confidence intervals, holdout structures, or brand names associated with those tests. That makes the claim difficult to evaluate independently.
The bottom line: AppLovin may well be incremental for many brands. What this case study demonstrates is that at $10K/week for a cannabis beverage D2C brand, the channel did not produce measurable lift when tested with a rigorous causal design. Spend level, product category, creative strategy, and audience profile all matter. The only way to know is to test for your own business.
What Should You Do If AppLovin Isn't Delivering Real Performance?
Based on the test results, Cann made an immediate decision: pause AppLovin and reallocate the $40K/month into Google, which was already showing promise as a scaling channel. Meta spend was left untouched because it was performing well.
Cole's framing captured the strategic value clearly: even if the reallocated budget broke even elsewhere, the outcome would be identical to what AppLovin was delivering. The floor was zero, and everything above it was pure upside.
Decision Framework
Option | Action | Rationale |
|---|---|---|
Chosen: Pause + Reallocate | Kill AppLovin spend, shift $40K/month to Google | No lift detected; budget better deployed elsewhere |
Alternative: Rerun at Higher Spend | 2-3x budget, expanded holdout, 4-6+ week test | Would only make sense if there were strategic reasons to believe a higher spend threshold would unlock performance |
Future: Test Other Channels | Run the same holdout playbook on Meta and TikTok | Establish baselines across the full media mix |
What Every D2C Brand Should Take Away from This Test
Platform ROAS is not real-world performance. AppLovin was reporting returns that looked attractive on a dashboard. The geo holdout showed those returns did not correspond to revenue that would disappear without the spend. The platform was likely taking credit for conversions that would have happened through other channels or organically.
Third-party attribution tools can compound the problem, not just solve it. The 4.77 Triple Whale ROAS in December looked more credible than the in-platform number precisely because it came from an independent source. The geo holdout test showed that both were wrong in the same direction. Attribution modeling (whether from the platform itself or a third party) cannot answer the causal question. A holdout test can.
Geo holdout tests are the fastest way to cut through attribution noise. This test took 19 days and cost ~$30K in media spend. The answer it produced: don't spend $480K+ this year on a channel that isn't pulling its weight. The ROI on the test itself is extraordinary.
Skepticism is warranted, but testable. Half the D2C community swears by AppLovin; the other half calls it a scam. The productive move is neither: it's designing a test that produces a definitive answer for your specific business, at your specific spend levels.
Lack of geographic reporting is a red flag. Unlike other ad platforms, AppLovin cannot break down delivery by State or DMA in their reporting (only Country level is available), which makes it functionally impossible for advertisers to audit targeting accuracy. That should factor into trust assessments.
Results are spend-level-specific. This test proved AppLovin was not driving measurable lift at $10K/week for Cann. A different brand with different scale, creative, and audience might see a different result. That's exactly why you test rather than assume.
Methodology matters at least as much as the conclusion. MTA, geo holdouts, and platform-reported ROAS will often give three different answers to the same question. The right comparison is not which number is biggest. It's which methodology answers the question you're actually asking: did this spend cause revenue that wouldn't have existed without it?
What This Test Cost vs. What It Saved
This test took 19 days and ~$30K in media spend to execute. The answer it produced redirects $480,000/year in ad budget away from a channel that was not delivering measurable lift and into channels where performance can be validated.
The ROI on the test: 16.7x in year one.
BlueAlpha runs geo holdout tests using Bayesian Structural Time Series models with synthetic controls, the same causal inference methodology used in academic research and by the largest measurement teams in tech. If you're spending $20K+/month on any channel and can't prove it's driving real sales, you have the same question Cann had. The difference is whether you answer it with data or keep debating it in Slack.
Get this case study as a PDF
