Free Competitive Benchmark Report
See where your marketing system is breaking down and what it is costing you.

The Marketing Health Diagnostic analyzes your public Meta and Google advertising footprint and compares it to relevant competitors. It shows where your system is structurally sound and where hidden risks are preventing learning, efficiency, and scale.
The diagnostic reveals the problems.
BlueAlpha is the system that fixes them.
Most marketing inefficiency is invisible until it becomes expensive.
The Marketing Health Diagnostic is designed to surface those risks early. It shows how your creative and channel operations behave in market and where structure is missing.
This diagnostic is the first step.
BlueAlpha turns those findings into continuous, measurable reallocation.
Competitive scorecard
What this chart shows
A consolidated scorecard summarizing the overall health of your marketing system.
What is measured
Overall marketing health score
Meta health score
Google health score
Platform diversification score
Operational efficiency indicators
What this chart shows
The score reflects absolute system health. Rankings show how you compare to peers. A strong rank does not imply safety if absolute health is weak.
This chart establishes where structural risk exists.

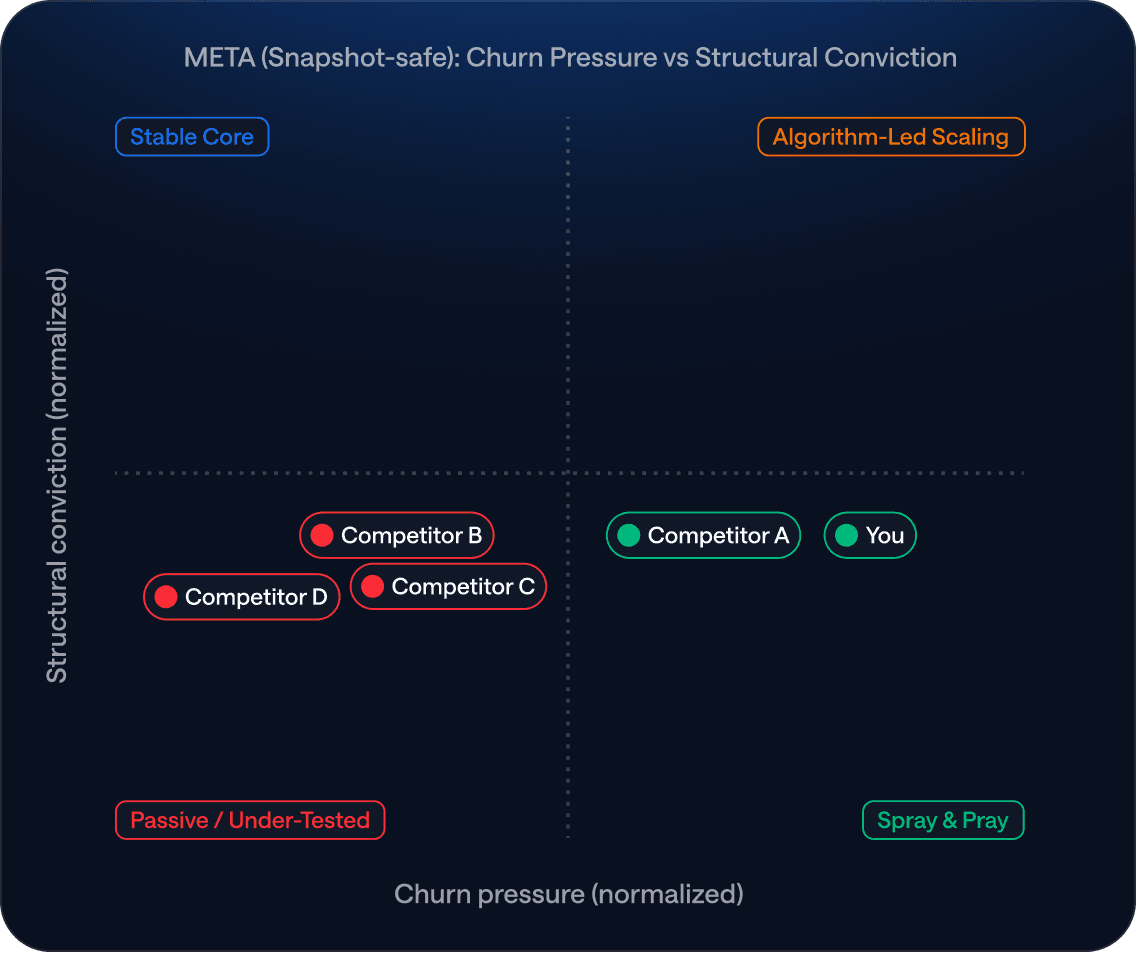
Meta Matrix
What this chart shows
A quadrant placement that positions your Meta program based on churn and conviction.
What is measured
Recent launch rate
Short-lived creative share under 14 days
Concentration among top creatives
What this chart shows
Quadrants distinguish between teams that build durable creative systems and teams that cycle activity without accumulation.
This chart explains why Meta performance often plateaus.

Google Matrix
What this chart shows
A quadrant placement that describes how your Google program balances stability and refresh.
What is measured
Evergreen core share
Recent launch rate
Replacement ratio
What this chart shows
Healthy systems protect a core while refreshing deliberately. Extremes lead to stagnation or volatility.
This chart shows whether Google is stabilizing your system or masking deeper issues.

Attention vs dependency
What this chart shows
A comparison of where your team’s effort is going versus where your system depends on stability.
What is measured
Google evergreen share
Meta churn pressure
Estimated creative footprint size
What this chart shows
High imbalance indicates effort spent maintaining short-lived assets rather than building reusable learning.
This chart explains why teams feel overloaded without leverage.

Replacement vs winners
What this chart shows
The relationship between creative replacement and the presence of durable winners.
What is measured
Replacement ratio
Evergreen core share
What this chart shows
Healthy systems prune intentionally while growing a core. Weak systems stagnate or churn.
This chart reveals hygiene gaps.

Monoculture risk
What this chart shows
The degree to which your program is concentrated in particular formats or surfaces.
What is measured
Meta format dominance
Meta surface dependence
Google format dominance
What this chart shows
High concentration increases fragility and limits learning transfer across platforms.
This chart identifies structural exposure.

Replacement vs winners
What this chart shows
The distribution of observed Meta creatives across messaging categories.
What is measured
Feature or product messaging
Use-case messaging
Price or promotional messaging
Uncategorized or unstructured messaging
What this chart shows
Structured messaging enables scalable learning. Unstructured mixes slow iteration and scale.
This chart explains why wins fail to replicate.
What it does
Surfaces structural risk and inefficiency
Shows how your system compares to peers
Identifies where learning is breaking down
What it doesn’t do
Measure ROI, ROAS, CAC, or revenue
Attribute causal lift
Reallocate budget automatically
That requires a system like BlueAlpha, designed to analyze and optimize your marketing mix in real time.
Where BlueAlpha comes in
The Marketing Health Diagnostic shows you where the system is failing. BlueAlpha is the operating system that fixes it. BlueAlpha enables teams to:
Measure incrementality with confidence
Identify wasted spend in real dollars
Reallocate budget continuously
Track improvement in system health over time
Drive the business outcomes that matter
Request Your Free Competitive Benchmark Report
You'll receive a personalized PDF report analyzing your brand against 5-10 relevant competitors across Meta and Google. The report includes your competitive scorecard, risk areas, and specific recommendations.
At the end of the diagnostic, you will have the option to book a walkthrough to see how BlueAlpha translates these findings into measurable reallocation and sustained efficiency.
No account access required. No preparation needed.
Note: if you are not currently active on Meta and Google, this report may not have value for you - feel free to book a demo to talk through more custom solutions