Matthias Stepancich
How to Measure Offline Channels (OOH) with MMM & Geo Hold-Outs
Learn how to quantify incremental traffic and CPA from offline media - using geo-testing and MMM
Out-of-Home
Measurement

Why This Playbook Exists
Offline media (subway posters, billboards, street furniture) can boost upper-funnel reach but is notoriously hard to measure.
This playbook shows how one of our customers used a four-week OOH test, a geo split, and Marketing Mix Modeling (MMM) to quantify incremental traffic and cost per acquisition.
You can replicate the same framework to decide whether to scale, refine or pause your offline spend.
Key Outcomes Achieved
+60k incremental website visitors (95% Confidence Interval) at $4 incremental CPA.
CPA testing confirmed effectiveness but validated our concerns about cost viability → reallocated to proven efficient channels.
When to Use This
Use-case | Signals it fits |
|---|---|
First offline test (OOH, transit, print) | Over $20k media budget, clear geo targeting options |
Board asks for “Show me impact” | Need statistical confidence before scaling |
Need to compare offline to digital ROI | MMM already running for digital channels |
Prerequisites
Access to daily (or weekly) web sessions and conversions by market
Ability to withhold media in at least one comparable geo region
MMM tooling that supports geo dummies / synthetic control
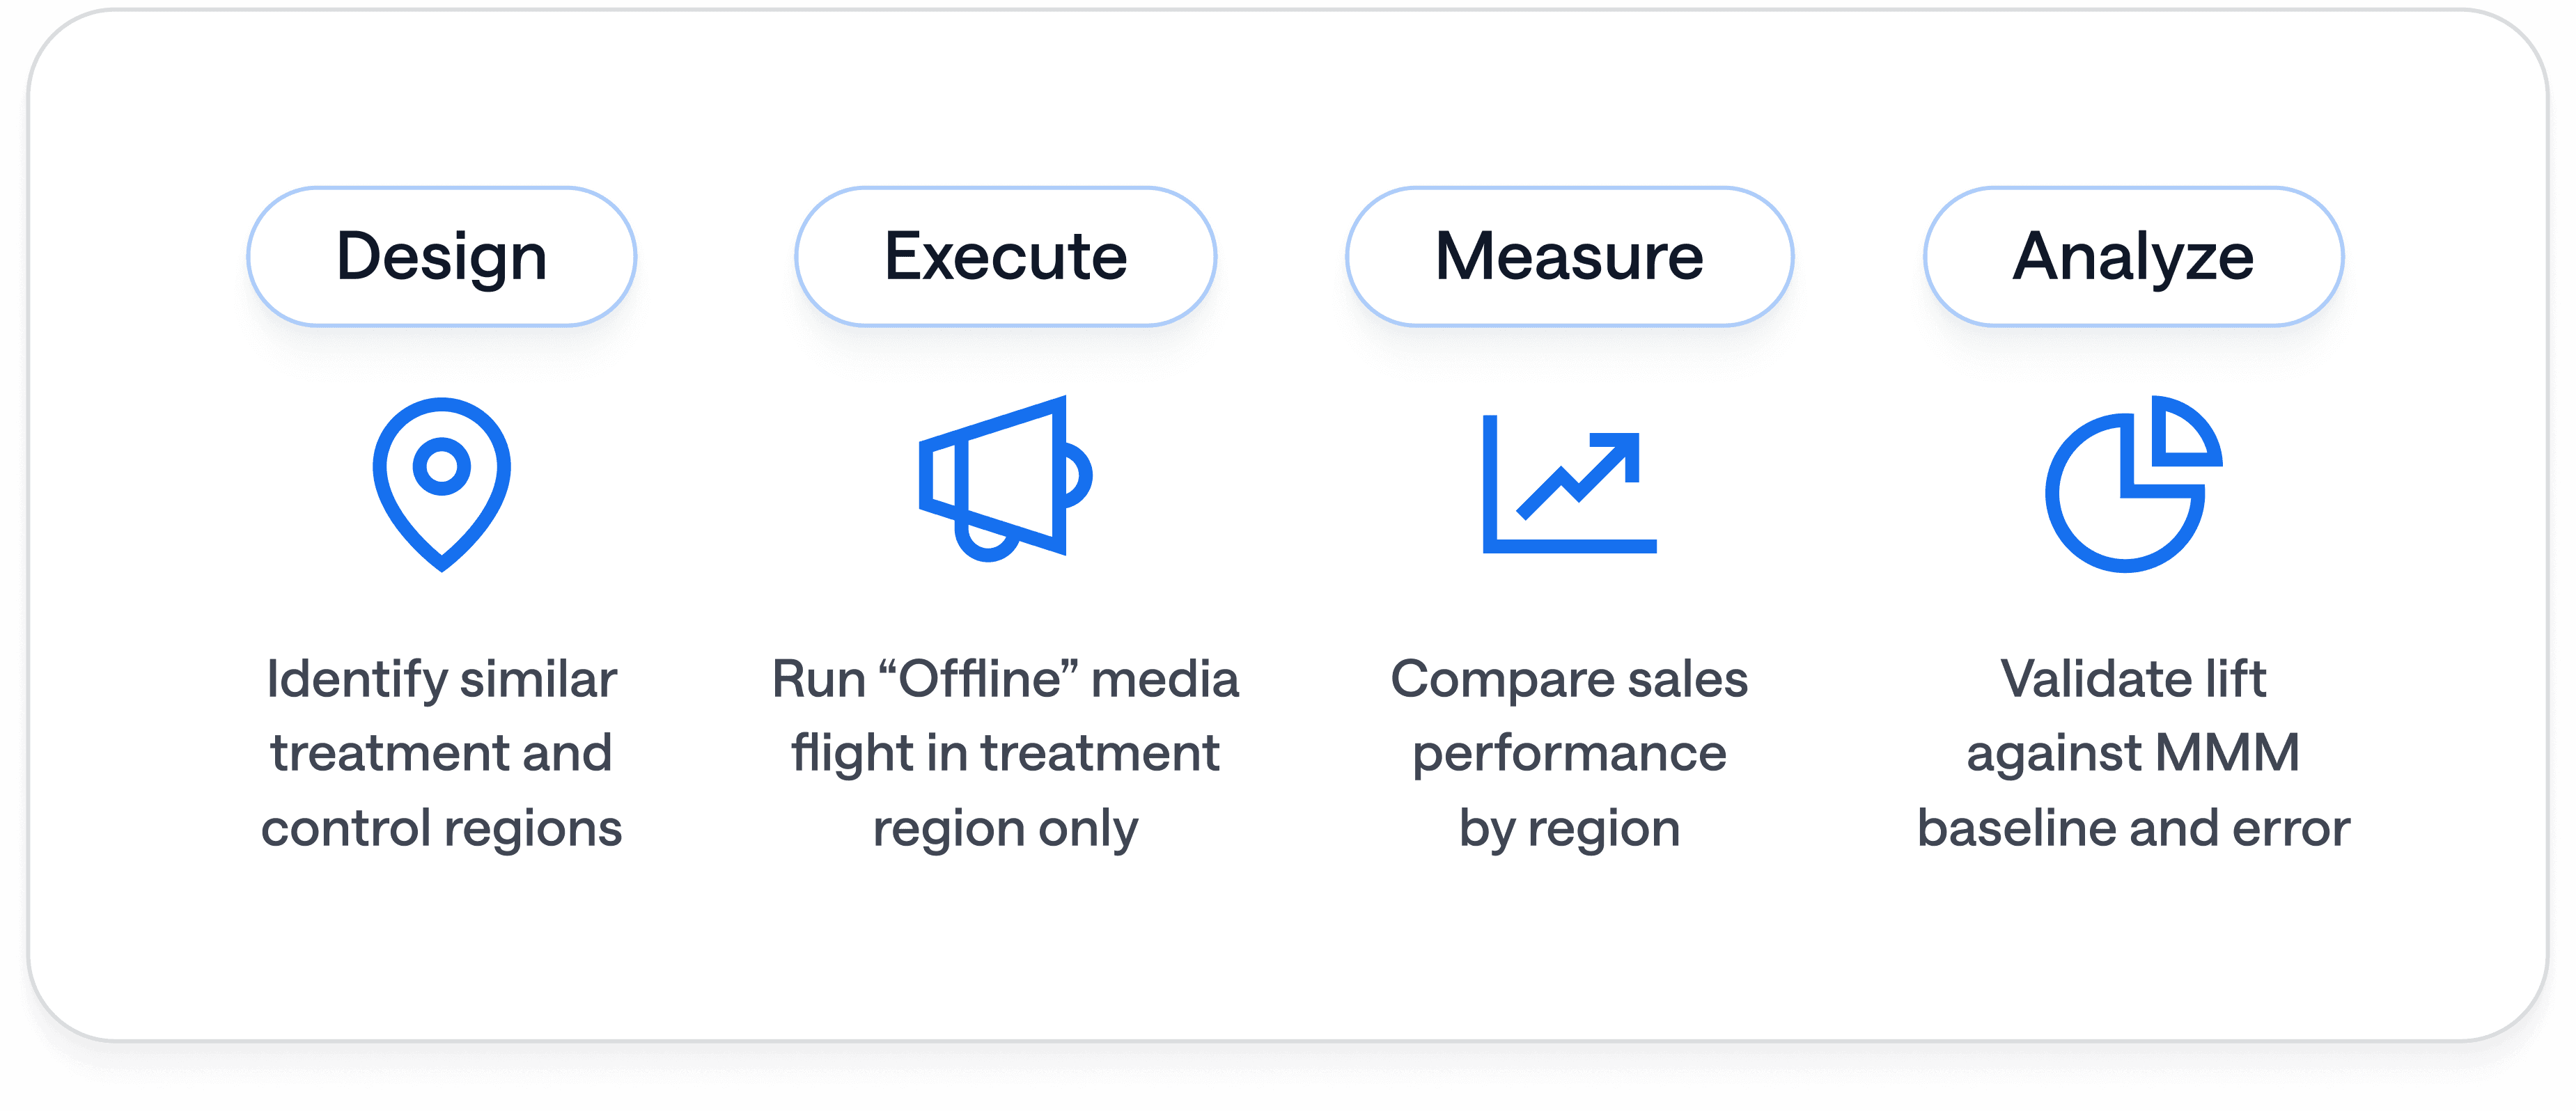
BlueAlpha’s Approach
Define KPI hierarchy
Primary: new site users
Secondary: sign‑ups, purchases
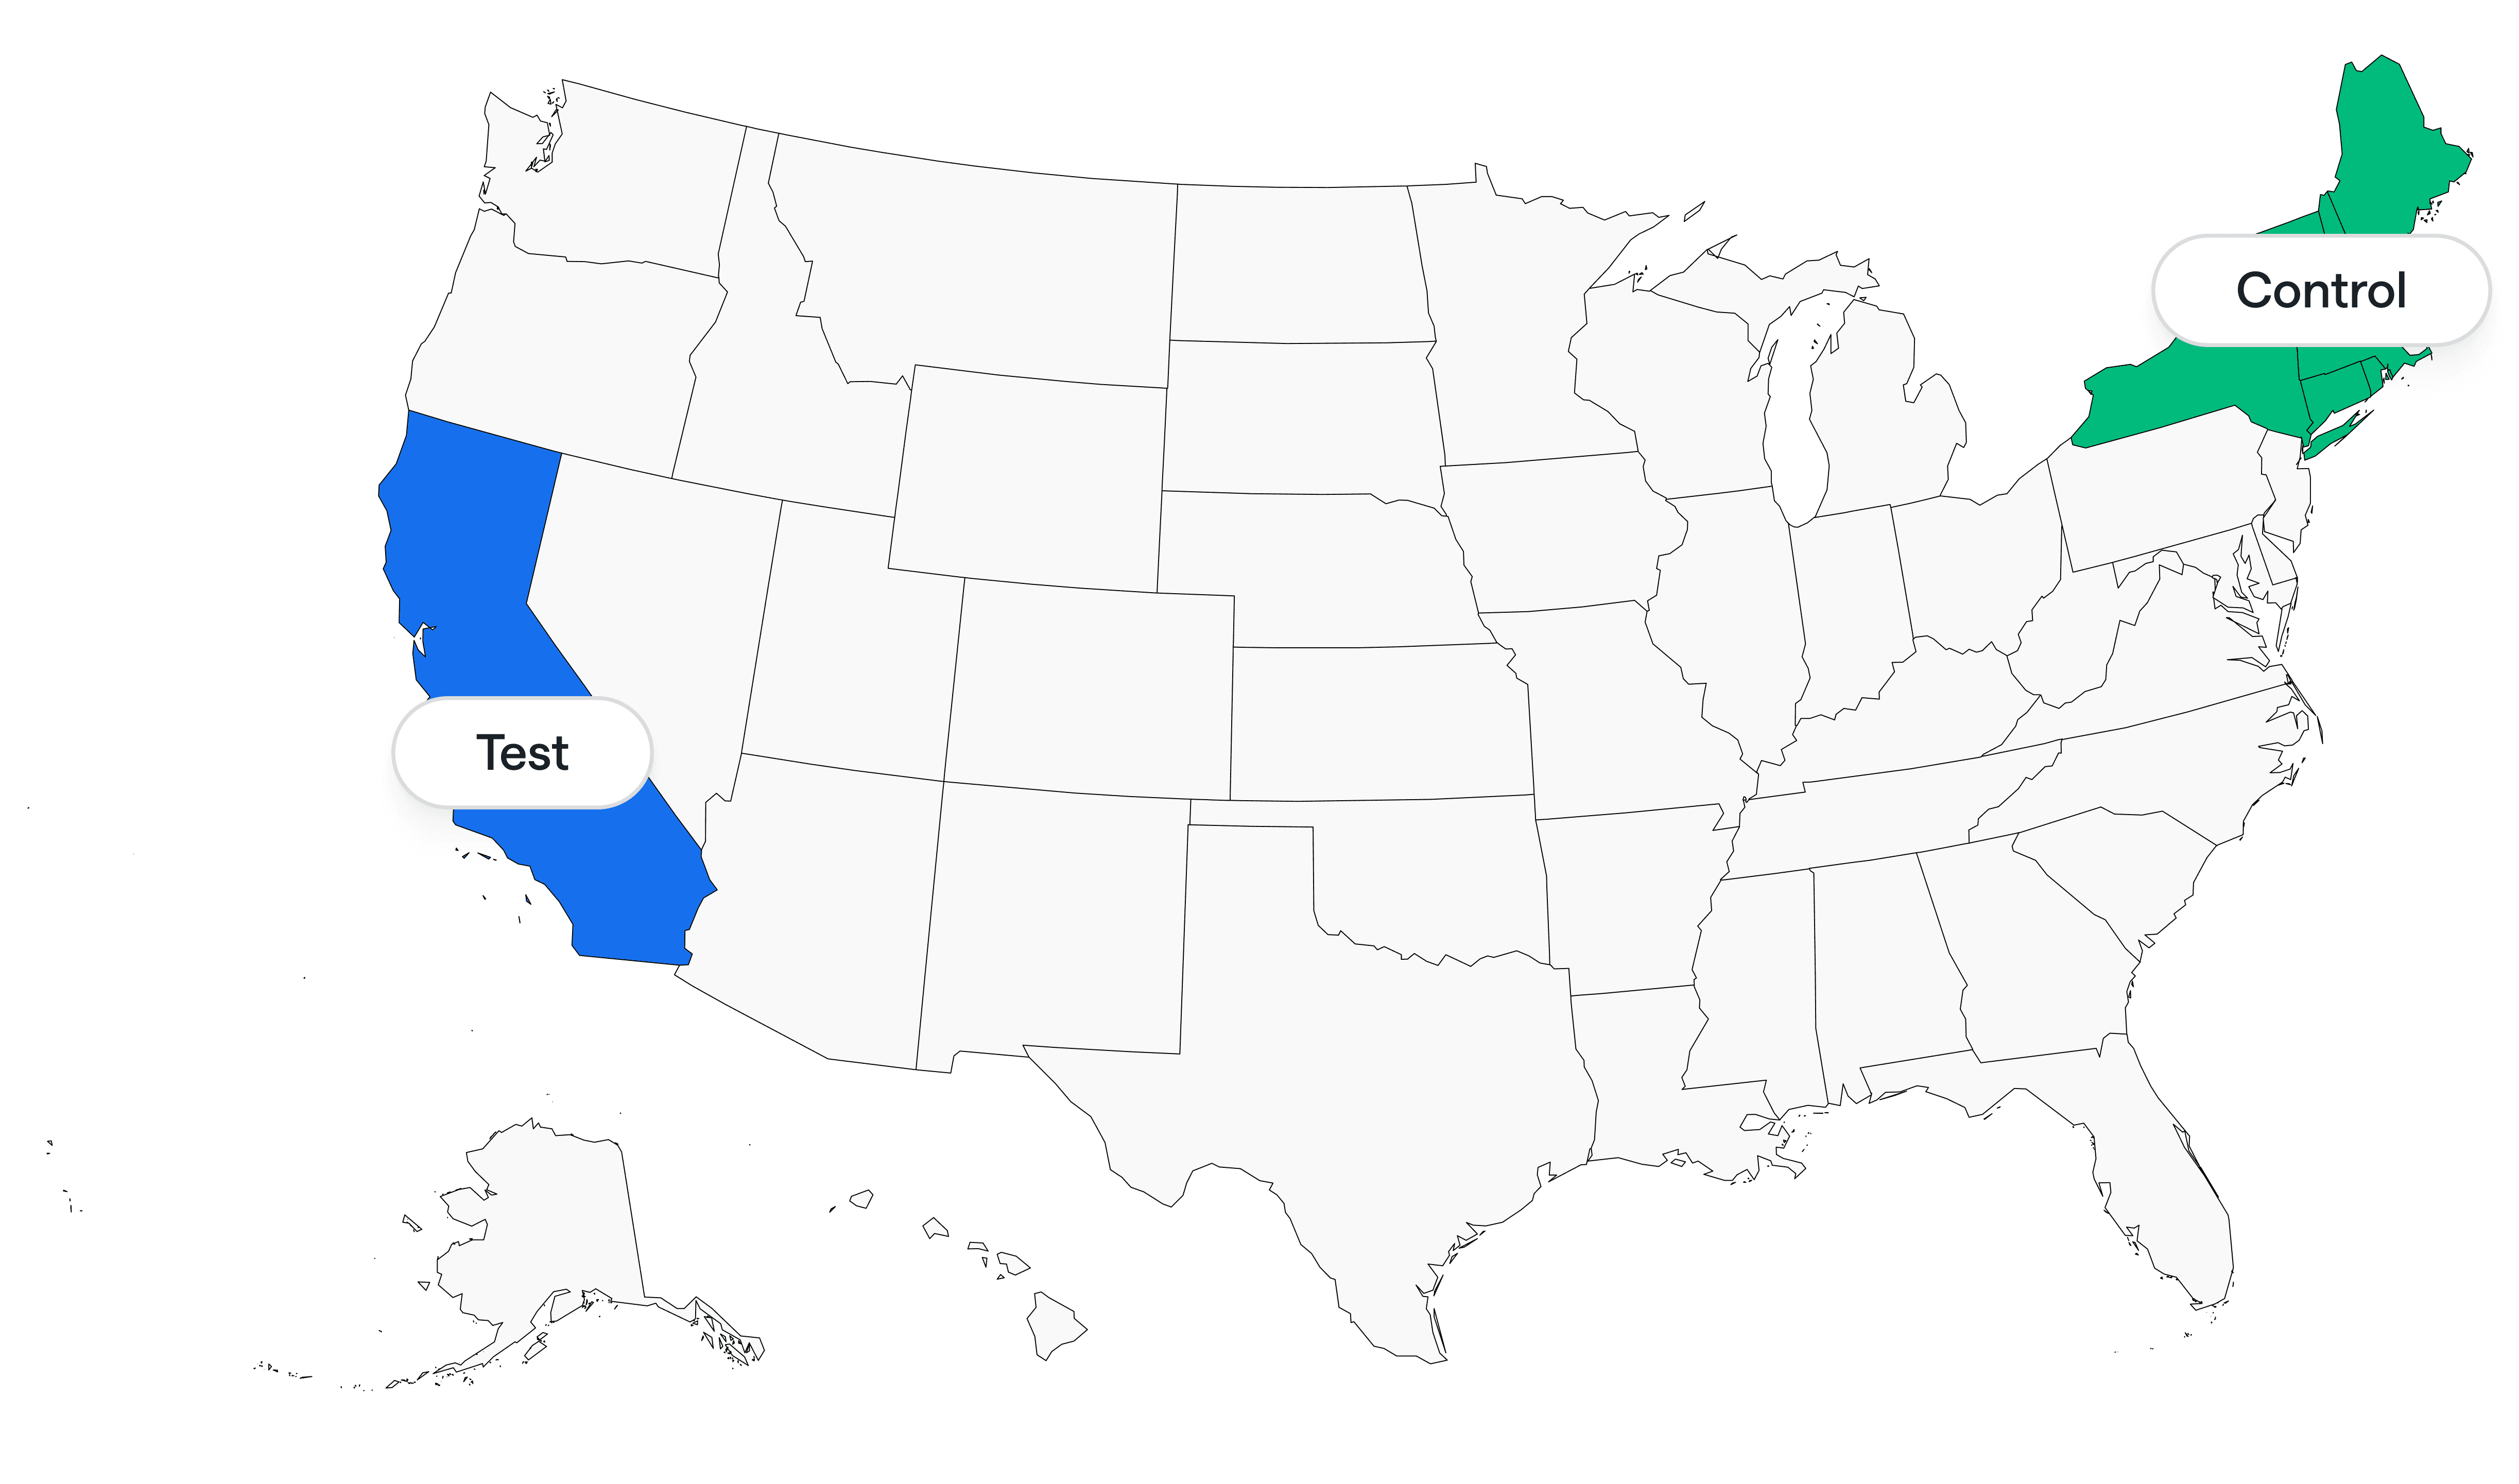
Select test vs control markets
Example: Run creative in City A subway; hold out City B (similar pop. & baseline traffic).
Allocate media
Even flight across 4 weeks; track impressions & spend daily.
Collect data
Export sessions, sign-ups, purchases by market. Tag spend by channel.
Model with MMM + synthetic control
Add a binary “City A × week” variable. Validate lift at 95% confidence.
Calculate incremental CPA
Spend ÷ incremental outcome for each funnel stage.
Decide
If traffic CPA < goal → keep for awareness.
If conversion CPA > threshold → pause or refine creative/offer.
Results Template (anonymized)
Metric | Lift (A) | Incremental CPA | Confidence |
|---|---|---|---|
New users | +60k | $4 | 95% |
Sign-ups | +95 | $2.3k | 95% |
Purchases | +12 | $16k | 95% |
Interpretation: Offline media delivers cost-efficient awareness, but conversion CPA remains above target at current spend level.
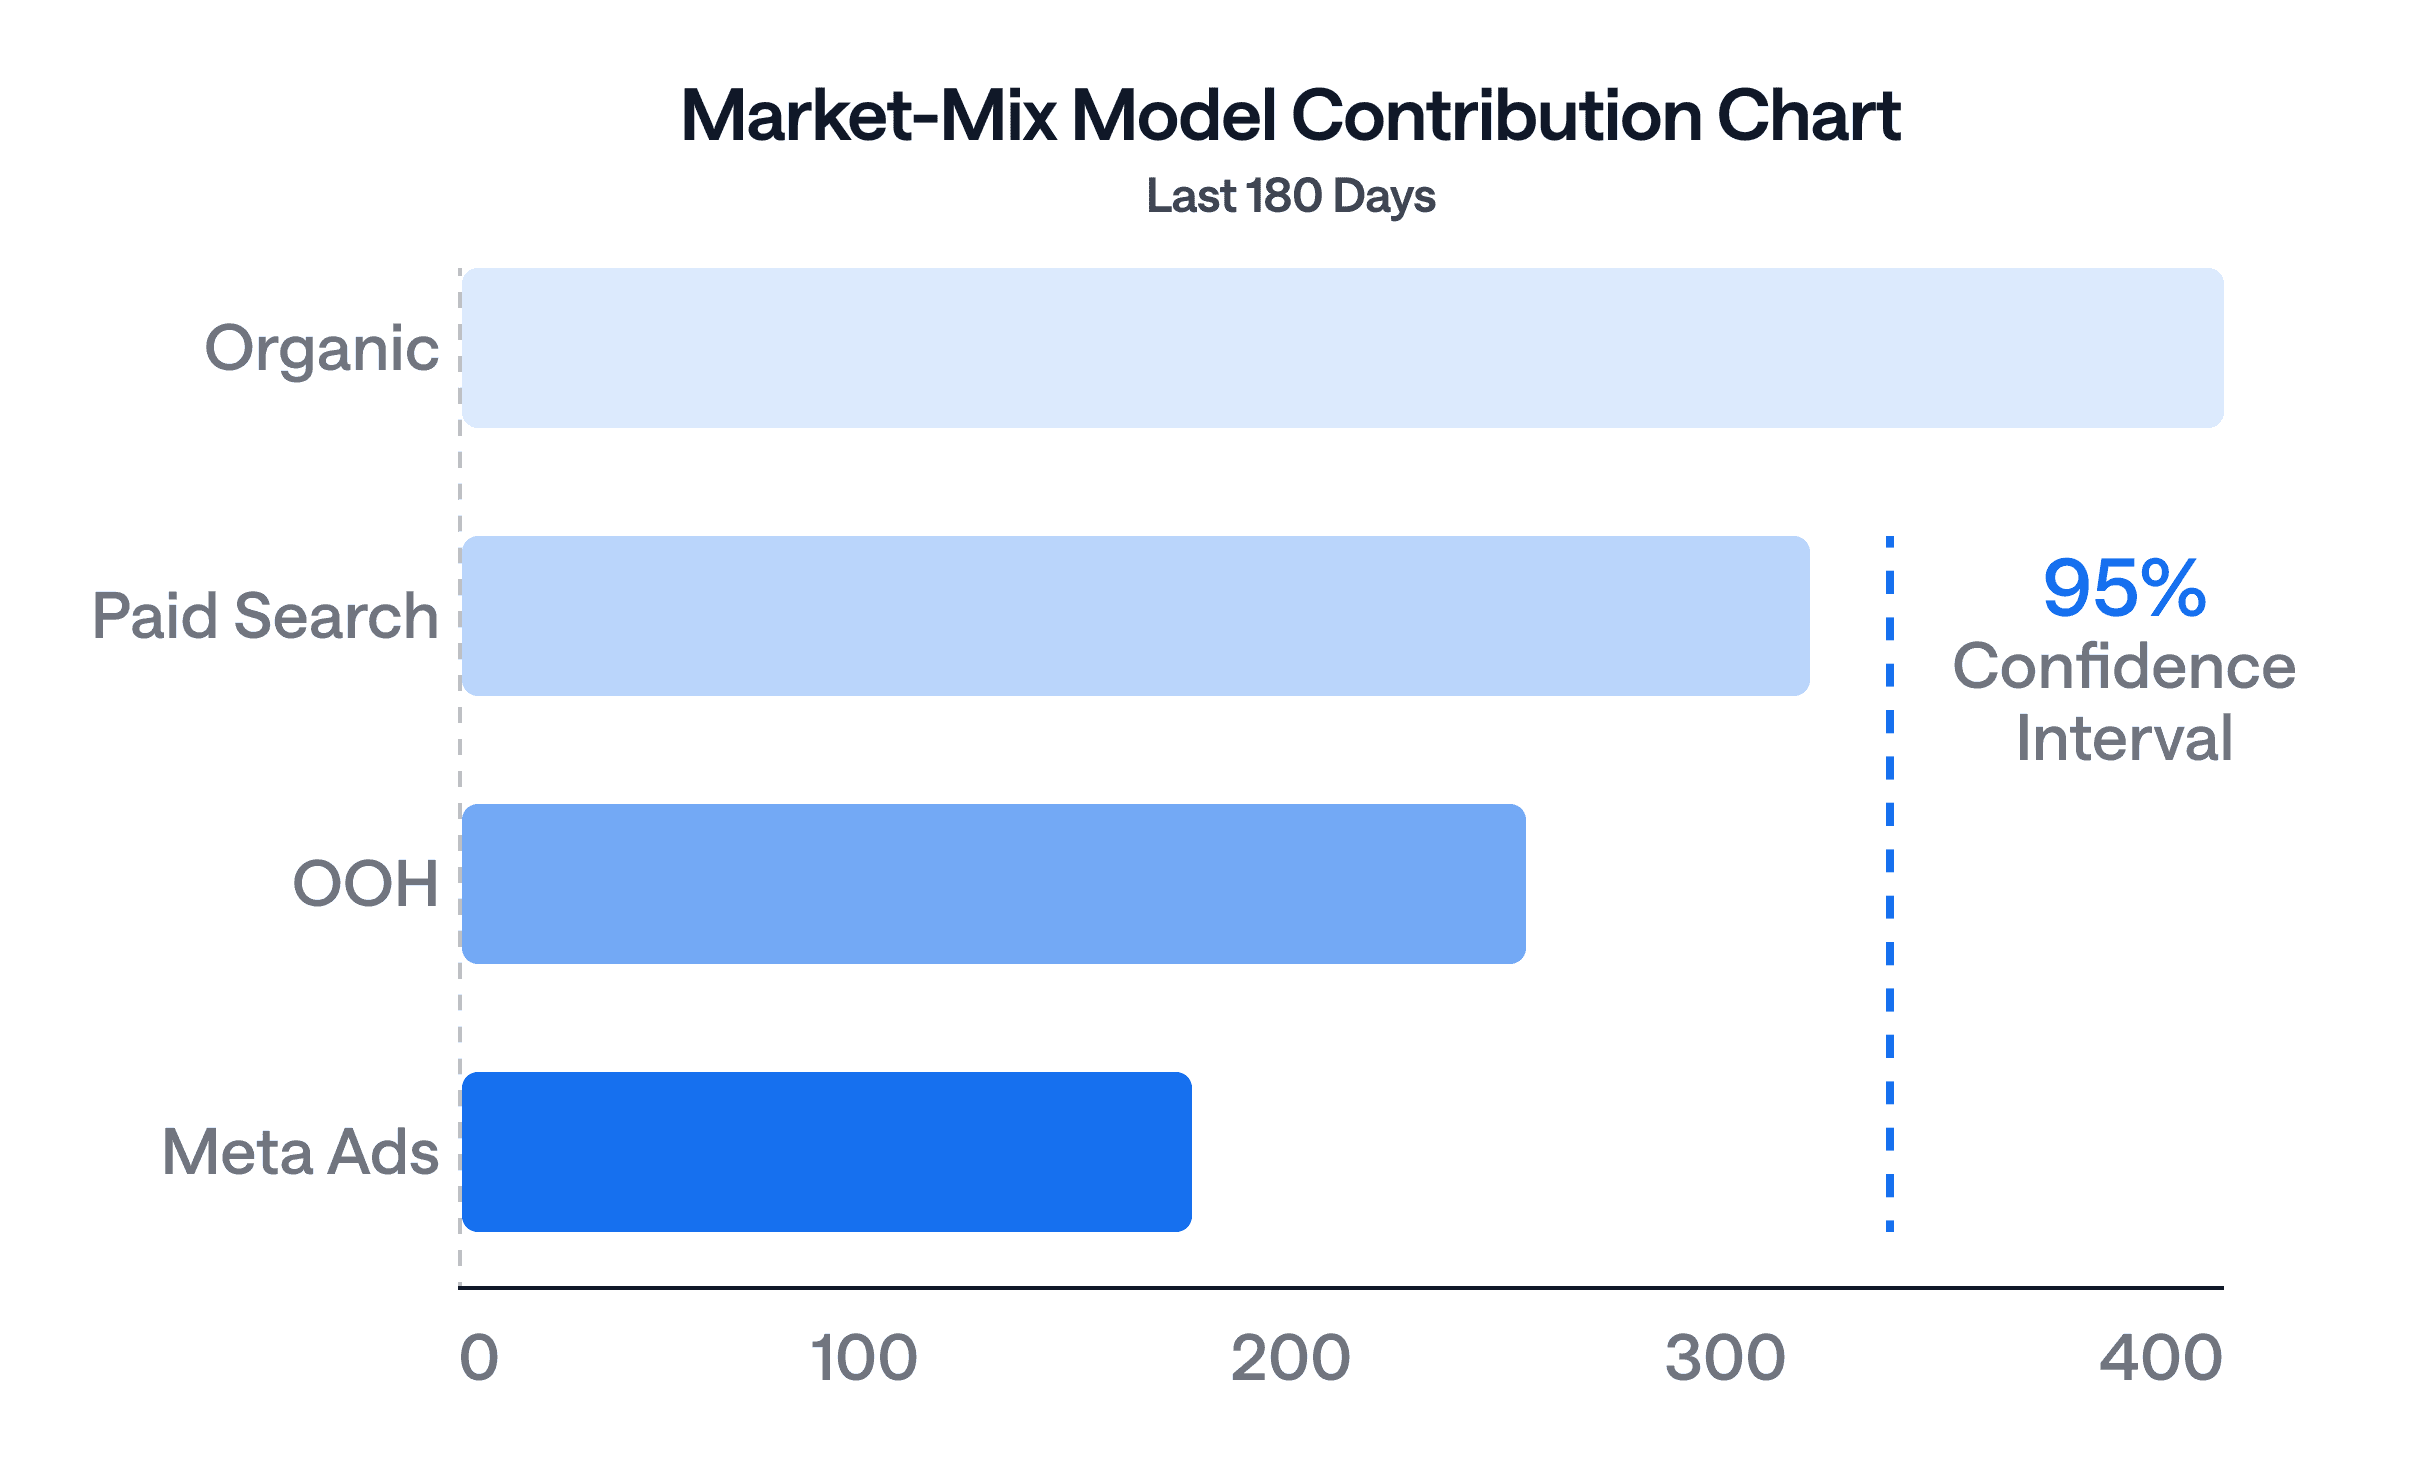
MMM Contribution
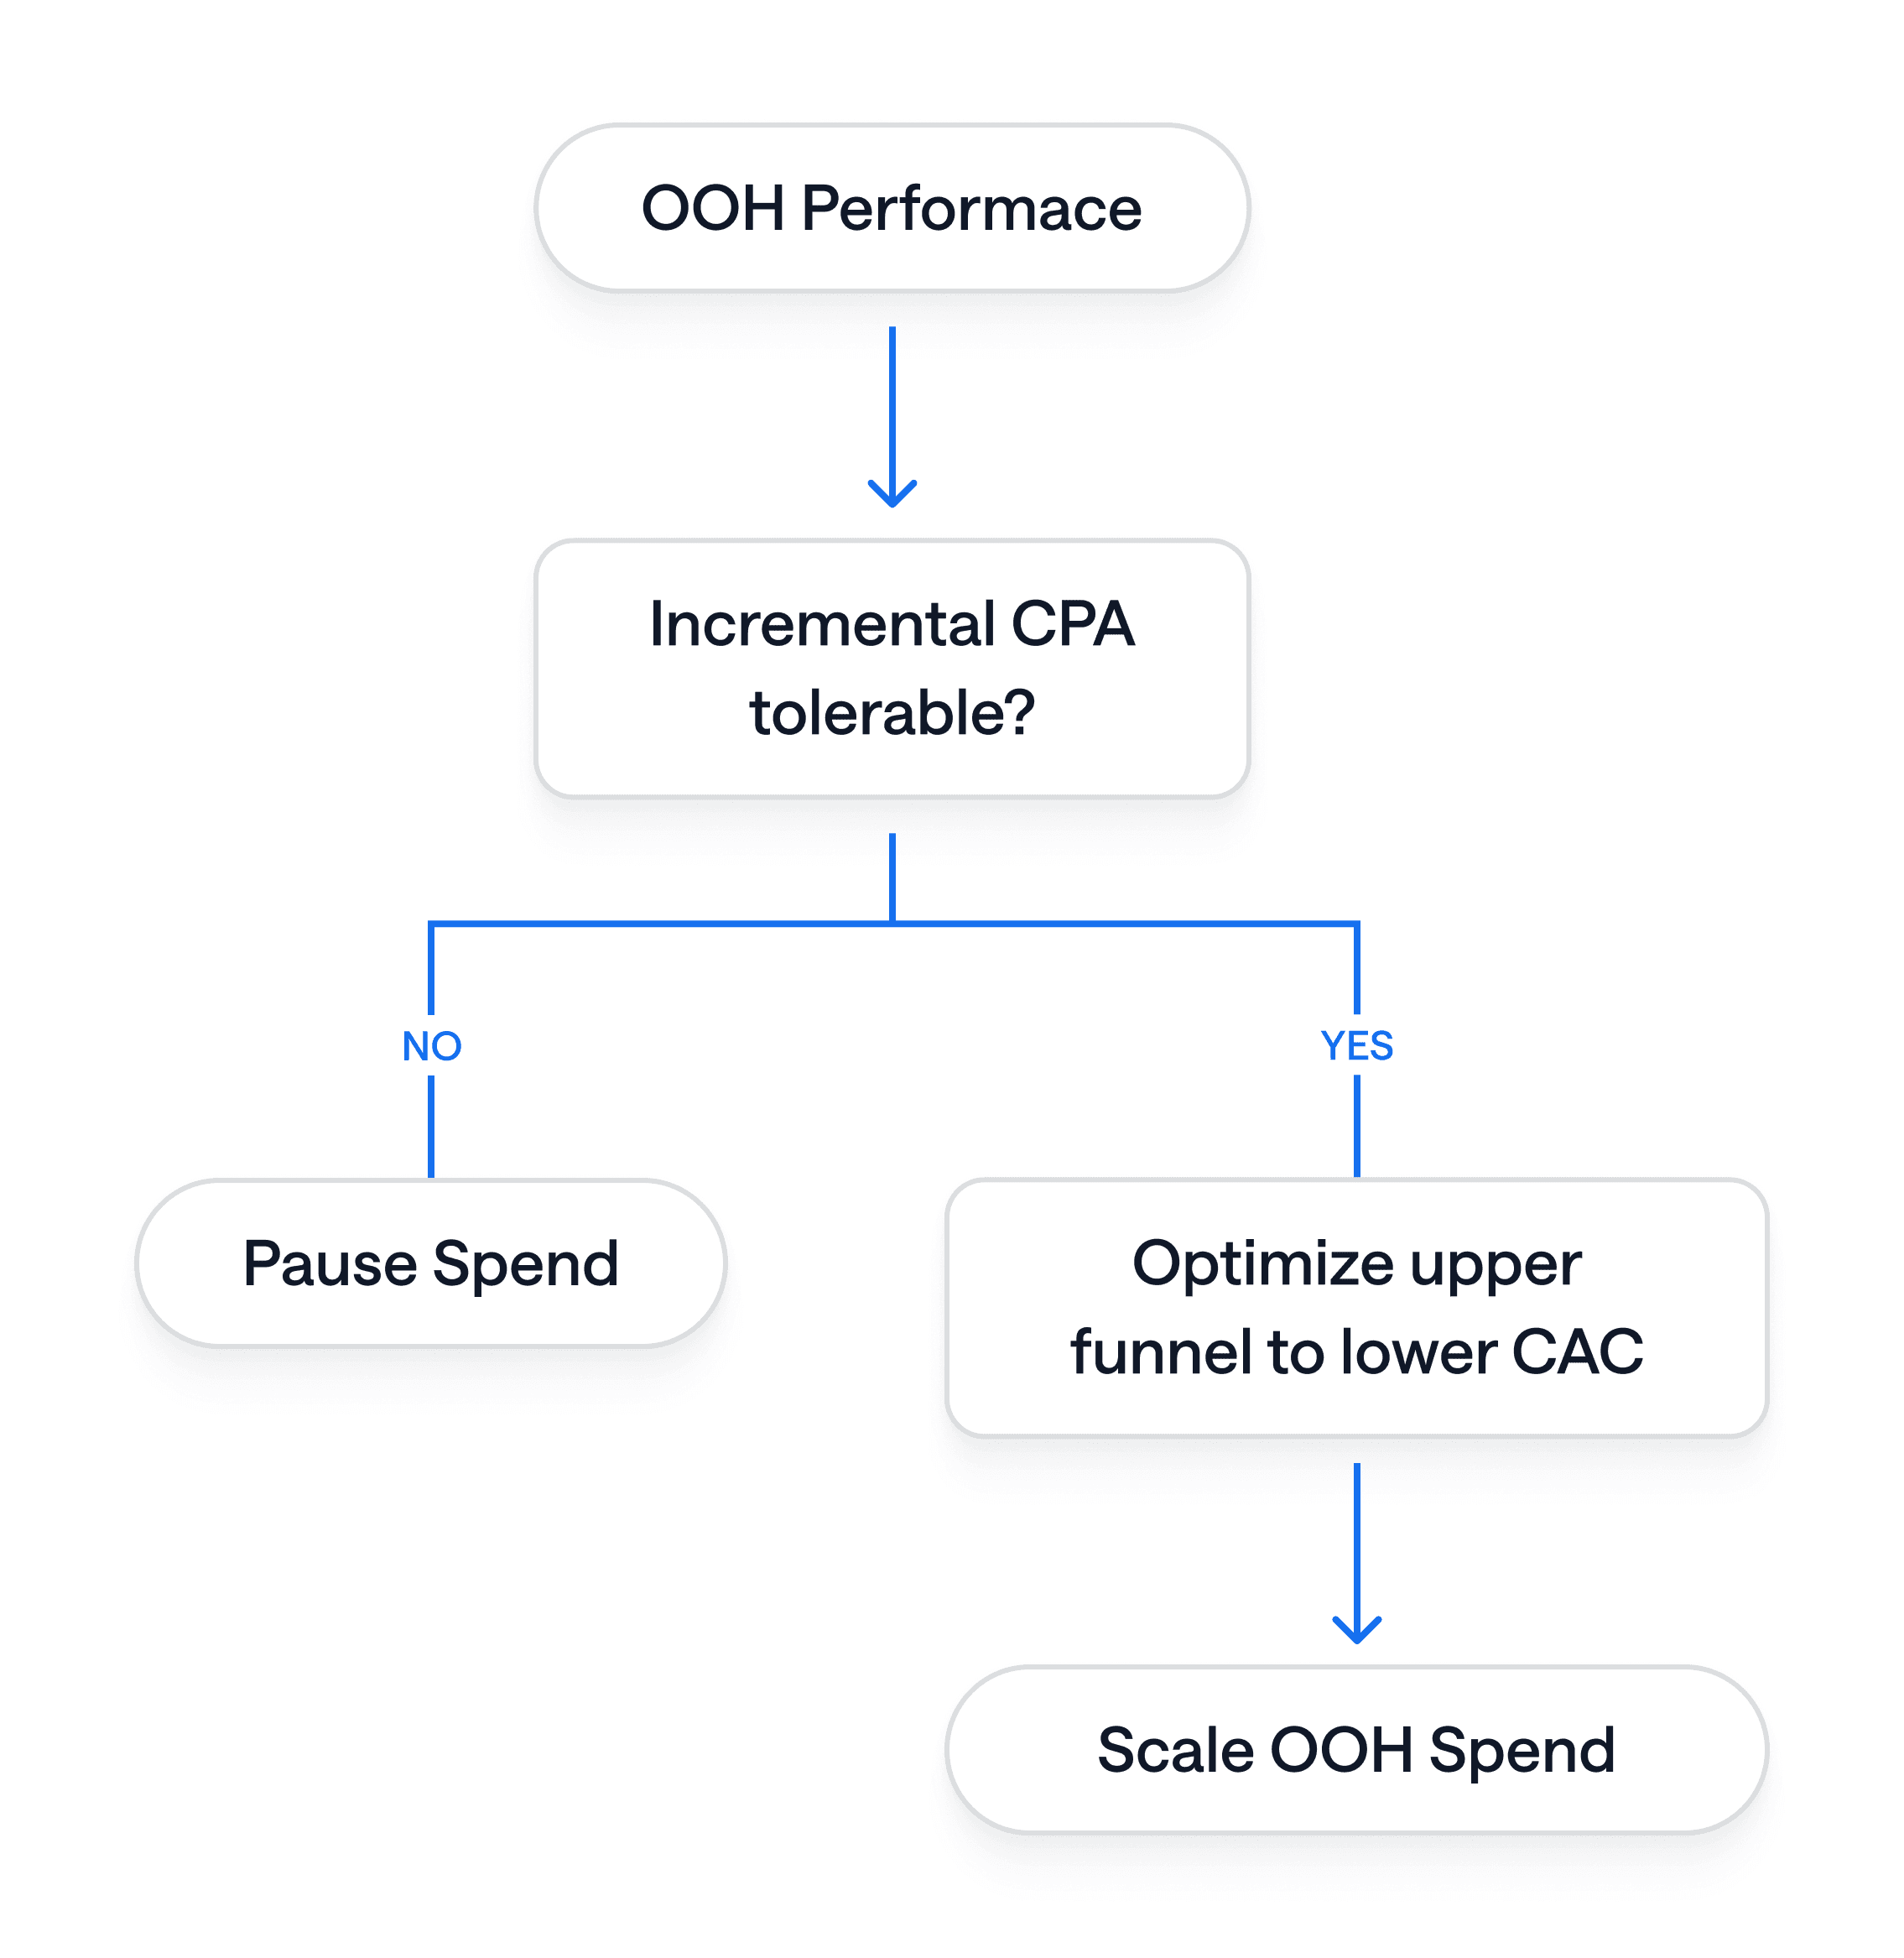
Decision Tree
Common Pitfalls to Avoid
Insufficient control market; pick geos with ≤10% baseline variance.
Too short a flight; 2-week bursts rarely beat noise; aim for ≥4 weeks.
Attribution overlap; switch off local digital promos or tag them separately.
Ignoring confidence intervals; lift without significance is just noise.
Replication Checklist
✔︎ | Task |
|---|---|
☐ | Define primary & secondary KPIs (e.g., new users, sign-ups). |
☐ | Select ≥ 2 comparable markets for “test” vs “control”. |
☐ | Reserve offline media exclusively in test market for ≥ 4 weeks. |
☐ | Ensure daily (or weekly) outcome data by market flows into your data warehouse. |
☐ | Add a “geo x week” dummy to your MMM specification. |
☐ | Run model, verify ≥ 90% power, 95% confidence. |
☐ | Calculate incremental CPA for each funnel stage. |
☐ | Document spend-reallocation decision and next-step hypothesis. |