The CMO's Guide to Cross-Channel Budget Optimization
Channel marketing optimization is the disciplined practice of managing every paid, owned, and earned touchpoint as a single, dynamic portfolio.
The marketing chessboard keeps adding new pieces: TikTok ads, retail media networks, connected TV, affiliate marketplaces, podcasts, and a dozen data-clean rooms, each claiming to solve the problem. That explosion creates reach, but it also fragments budgets, reporting, and accountability. If you are still optimizing channels one at a time, you are leaving profit on the table.
Many brands have responded to this by doubling down on what felt measurable and safe. They pour money into lower-funnel channels, celebrate platform-reported ROAS, and miss the larger question: What is the next incremental dollar really worth?
Channel marketing optimization is the disciplined practice of managing every paid, owned, and earned touchpoint as a single, dynamic portfolio. It uses causal measurement, not click-based attribution, to see which moves generate genuine lift and which produce nothing more than noise. The payoff is real. When one D2C brand ran this kind of audit, it identified $2.12M in annualized wasted spend and cut blended CAC by 14% over nine months.
This guide walks from audit to action. By the end, you will know how to turn incrementality and diminishing-returns curves into a system for continuous, high-profit growth.
Single-Channel, Cross-Channel, and Omnichannel: What Each Means
Term | Focus | Ownership | Primary Metrics |
|---|---|---|---|
Single-channel optimization | Tuning bids, creative, and audiences inside one platform | Channel specialist | CPC, CPL, in‑platform ROAS |
Cross-channel optimization | Moving budget between multiple paid channels | Growth, media, or agency team | Incrementality, iROAS, diminishing returns |
Omnichannel experience | Delivering a consistent brand story across paid, owned, and offline touchpoints | CX, CRM, brand teams | Engagement, retention, CLV |
Cross-channel optimization is the engine of profit, while omnichannel consistency is the fuel for brand equity. You need both, but you tackle them in different ways.
Audit First: Your Baseline Performance Map
Before you can optimize you need a brutally honest baseline. Pull the last six to twelve months of spend, impressions, clicks, conversions, and attributed revenue for every channel. Look for three signals:
Saturation: rising CPAs or falling marginal ROAS even as spend grows. That is the textbook sign of diminishing returns. Search often hits this wall first because brand terms capture the most available demand first.
Undervalued upper funnel: channels like CTV or influencer partnerships that look weak on a last-click dashboard. Watch for spikes in branded search, direct load, or store traffic whenever an upper-funnel flight runs.
Blind spots in measurement: missing tags, tag deduplication failures, or walled-garden metrics that over-credit themselves. These gaps habitually push budget toward what is easy to count instead of what is truly working.
This audit exposes halo effects you cannot see if you stare at each dashboard in isolation. One publisher ran this audit and found an entire channel was negatively correlated with subscriber growth, invisible until every channel was scored against the same model. Document these patterns and you will already see budget stuck in low-yield trenches and neglected in high-potential zones.
The hardest version of the third signal is a channel with no dashboard at all. Out-of-home, transit and print produce no tag to be missing and no walled-garden metric to over-credit, so they tend to be excluded from the audit entirely rather than scored badly in it. That is a measurement gap, not an absence of contribution, and the OOH measurement playbook covers how to bring those channels into the same portfolio view as the rest of the mix.
Map the Journey Your Buyer Actually Walks
Growth leaders outperform the competition because they optimize for how buyers move, not how org charts work. Build a journey map with four stages:
Stage | Objective | High‑leverage Channels | North‑star KPI |
|---|---|---|---|
Awareness | Create demand | CTV, YouTube, programmatic video | Incremental reach, brand lift |
Consideration | Nurture interest | Paid social, influencers | Engagement rate, qualified traffic, time spent with content |
Conversion | Capture demand | Paid search, retargeting, affiliate | Incremental conversions, iROAS |
Loyalty | Grow lifetime value | Email, SMS, in‑app | Repeat purchase rate, CLTV uplift |
Why build this map? Because media audits alone cannot explain why channels interact. The journey map reveals that a spike in YouTube spend followed by improved search conversion is not random. It is the psychological path your prospects walk, and that knowledge guides budget decisions far more reliably than a siloed dashboard.
Tie spend, creative, and measurement to these stages, and you instantly prevent the classic mistake of underfunding top-funnel activity.
Move From Attribution to Causality
Attribution answers the question, "Which tracked event happened latest before the conversion?" Causality asks, "What portion of the outcome would not have happened without this spend?" That shift matters because every platform is happy to claim credit it did not earn, and because privacy restrictions increasingly block user-level stitching across properties.
Causal measurement rests on three legs:
Marketing Mix Modeling (MMM): A top-down statistical model that ingests spend, media exposure, seasonality, price, promotions, and external factors, then returns marginal ROI curves by channel. Modern MMM, including our BlueAlpha approach, refreshes weekly, not yearly, thanks to Bayesian priors and GPU acceleration.
Incrementality testing: Geo splits, matched-market tests, ghost ads, or randomized holdouts. They deliver yes-or-no answers about lift, and they also feed stronger priors back into the MMM.
Scenario simulation: Once you own marginal ROI curves, you can run what-if scenarios. Move 20 percent of prospecting budget from Meta to TikTok and see the predicted profit delta before risking real dollars (see a real-world case study here).
Collectively these tools expose diminishing returns in precise dollar terms and free you to invest where incrementality is highest.
Dynamic Budget Reallocation Using Marginal ROI
Static quarterly plans cannot keep up with platform auctions or seasonality spikes.
That rigidity made sense when lead times for TV spots ran eight weeks and when data landed in spreadsheets a month late. Today, it strangles performance.
A dynamic budget is not chaos. Think of it as a portfolio with guardrails. You set a minimum presence for always-on channels that protect your brand, such as core search terms or remarketing lists. You define a ceiling for any line item whose marginal ROI curve is flattening, so spend cannot blindly scale into unprofitability. Within those limits you meet every four weeks, armed with fresh MMM insights, and ask a single question: Where will the next dollar earn the highest incrementality?
Notice what changes culturally. The conversation shifts from "Why did search miss its ROAS target?" to "Search is five thousand dollars past the knee of its curve. Let us pull that amount and pilot an OTT test in the Pacific Northwest, where our MMM shows latent demand". Finance can follow the logic, creative leads see new canvas, and the team bonds around business outcomes instead of channel turf. Klover ran a version of this shift: the model flagged a channel as saturated, the team cut spend, and conversions held while a leaner alternative scaled.
Align Creative So the Story Scales With the Budget
Budget reallocation only pays off when the audience hears a consistent voice across touchpoints. Without narrative alignment a hefty video flight might drive reach yet fail to prime search intent because the message is disconnected.
Start with one core story, expressed in a long-form asset such as a hero video, webinar, or anchor article. Break that story into atomic ideas that map to different funnel stages and formats. The hero video becomes six-second bumpers for YouTube pre-roll and vertical clips for Instagram Stories. Key phrases turn into headline variations for sponsored search. Proof points morph into carousel frames for LinkedIn.
Next, synchronize timing. When the hero video drops, schedule social teasers to appear within twelve hours and update search copy in the same week. Frequency caps ensure the same viewer is not hammered with identical creative across three platforms in the same hour. When you later refresh the headline, update every placement so the echo reinforces rather than confuses.
This orchestration looks simple on a Gantt chart, but it hinges on collaboration between media planners, brand writers, performance analysts, and external agencies. Use shared asset libraries, creative sprints that align with media sprints, and a version control system so every stakeholder sees the latest artifact.
Score Channels With a Portfolio Mindset: Fit, Behaviors, Levers
As you contemplate new channels or reconsider old ones, replace intuition with a structured rubric.
Fit gauges whether the channel's audience composition and consumption context align with your target segments. A fintech brand eyeing Twitch should examine whether high-income millennials who trade crypto are actually present in meaningful numbers, not assume gaming equals youth equals opportunity.
Behaviors examine the mechanics. Does the channel use first-price auctions that spike CPM volatility, or fixed CPV pricing that simplifies forecasting? Does creative require vertical video or long-form text? Do privacy settings limit remarketing lists? These operational details determine real cost and scalability.
Levers ask what you can control. Bid strategy, audience filters, creative formats, and partner support all count. The more adjustable parts, the faster you can optimize.
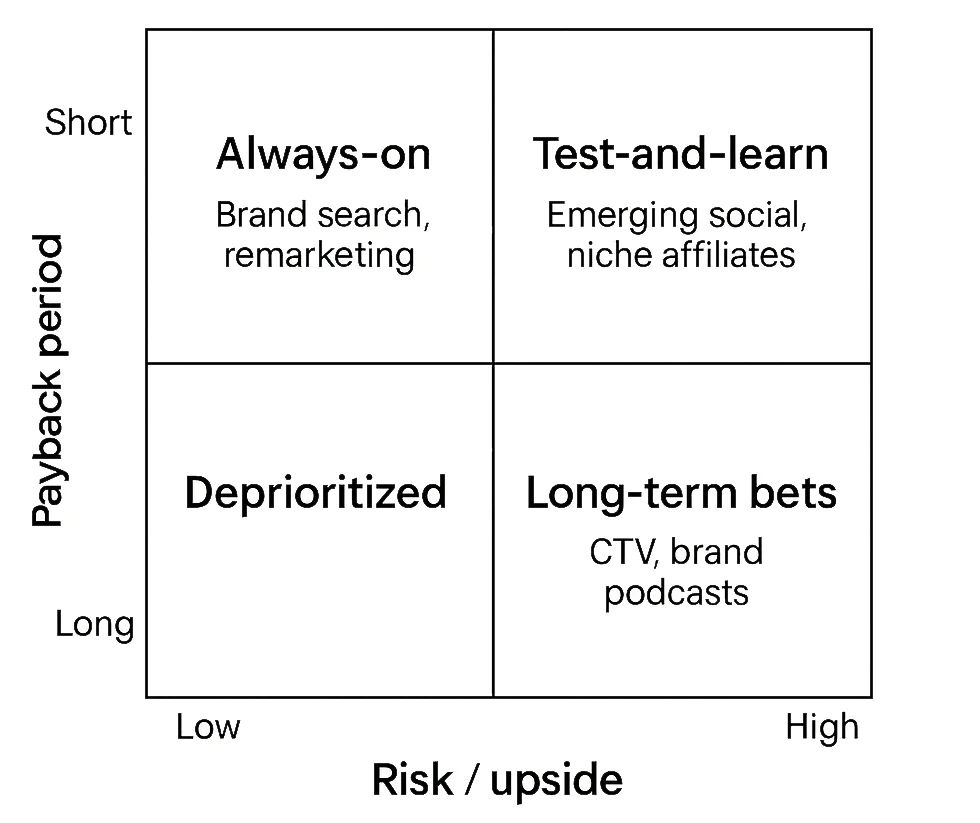
Score each dimension on a five-point scale, average the results, then plot channels in a two-by-two matrix: payback period on one axis, risk or upside on the other. The matrix segments channels into always-on, test-and-learn, long-term bets, or watch-list. Creating the matrix forces you to articulate why a podcast sponsorship belongs in an experimental bucket instead of the permanent roster.
Governance: Keep the Engine Honest
Without clear governance, channel owners will chase individual KPIs, agencies will protect their scopes, and data scientists will model in a vacuum. Senior leadership must formalize how decisions are surfaced and executed.
Begin with explicit objectives for each channel that roll up to a shared business target. If gross margin is the North-star metric, then paid search should optimize not for nominal ROAS, but for incremental margin after ad spend and fulfillment costs.
Next, define distribution tasks in detail. If the brand promise is 48-hour delivery, the channel plan must fund inventory buffers and last-mile logistics accordingly. If warranty support is a selling point, creative must communicate it and service teams must staff it.
When selecting or retaining partners, apply uniform criteria: revenue contribution, data transparency, brand safety, and strategic alignment. Document ownership of each relationship, and institute quarterly performance reviews that look beyond media metrics to business impact.
Finally, decide who leads. Leadership may sit with the manufacturer for product-driven brands, with the wholesaler when distribution scale matters, or with the retailer when customer intimacy is critical. Whatever the answer, write it down so the power dynamic is transparent. Clear leadership accelerates cooperation and conflict resolution.
Human Factors That Break or Scale Optimization
Even the smartest model fails if the people behind it misalign incentives. Four behavioral levers deserve attention:
Roles: Publish a RACI matrix for every optimization cycle. The data scientist owns model accuracy. The channel manager owns pacing and bid strategy. Creative leads are consulted on message adaptation. Finance is informed of major reallocations.
Communication: Agree on a common taxonomy and automate data sharing. When everyone defines incrementality and marginal ROI the same way, meetings focus on action rather than translation.
Conflict: Detect channel cannibalization early and mediate with data, not politics. A search manager who loses budget to CTV may push back. Use data from MMM and incrementality tests as the neutral arbiter. Celebrate the net profit the team won together so individuals see the upside of compromise.
Power: Power stems from control of scarce resources, unique data, or brand authority. Instead of denying power imbalances, surface them and channel them. Place leadership where product control or customer proximity matters most. A large retailer might demand margin concessions in exchange for shelf space; the manufacturer can trade higher margin for deeper data sharing that feeds the optimization loop.
Teams that master the soft stuff unlock hard revenue gains.
Build a Tech Stack That Serves Decisions
Many companies drown in MarTech bloat yet still lack the tools that matter for optimization. A useful stack has five layers:
Unified data lake: raw spend, cost of goods, inventory, pricing, offline sales, and macroeconomics land in one repository with common keys.
Privacy-first identity resolution: deterministic where regulations allow, probabilistic where they do not. The goal is stable aggregates, not user-level voyeurism.
Causal modeling engine: MMM refreshed weekly, enriched by incrementality test inputs and equipped with Bayesian priors so it learns even when data is sparse.
Scenario planner: a UI that lets marketers drag sliders for spend by channel, geography, and audience, then shows profit, revenue, and payback predictions instantly.
Activation hooks: bi-directional APIs that push new budget splits to ad platforms and pull performance data back into the lake so the loop closes without manual CSV drama.
This stack turns hundreds of siloed metrics into one actionable insight: where to spend next week.
Five Channel Optimization Pitfalls That Waste Budget
Data overload - treat metrics like a budget. If a number does not change decisions, cut it.
Over-saturating one channel - Early success clouds judgment. Track diminishing returns curves weekly.
Budget inertia - Avoid quarterly or annual planning lock-ins. Adopt rolling forecasts with scenario testing. Keep 60 percent of your budget flexible.
Siloed creative - without one owner of the brand narrative, messages fracture. Assign one brand steward for cross-channel narrative. Mandate that new assets pass a brand check before launch, no matter the channel speed.
Tech myopia - Tools never solve strategy gaps. Start with process, then find the minimum tech to execute. Map people, process, platform before signing contracts.
What Changes Next for Channel Measurement
Automated MMM will shrink refresh cycles from quarterly to daily.
Predictive saturation alerts will ping you before a channel hits the flat part of its curve.
Cookieless identity solutions will make incrementality testing, not user-level attribution, the default proof of value.
Generative creative will let you version ads to match micro-audiences in real time, but only if your measurement backbone can keep up.
Privacy regulation will tighten further, pushing attribution deeper into aggregated modeling.
Through these shifts, the brands that win will be those that master three timeless principles:
Seek causal truth, instead of the convenient lies of attribution.
Allocate in motion, guided by live marginal ROI curves.
Unify narrative and data, so every dollar spent tells one coherent story.
Do that, and your marketing program becomes a compounding asset rather than an expense line waiting for a CFO's red pen.
5 Actions for the Next 90 Days
Conduct a cross-channel audit and flag saturation points.
Launch one geographic holdout test to quantify incrementality in a pivotal channel.
Stand up a lightweight MMM proof of concept using the past twelve months of data.
Build a single creative calendar that maps every asset to a specific journey stage.
Convert your quarterly budget to a rolling four-week allocation with guardrails.
FAQ
What is channel marketing optimization?
Channel marketing optimization is the practice of managing every paid, owned, and earned marketing channel as positions in a single portfolio rather than as independent line items. It uses causal measurement (marketing mix modeling and incrementality testing) to identify where each additional dollar earns the highest return, and reallocates budget continuously based on that signal.
How is cross-channel optimization different from single-channel optimization?
Single-channel optimization tunes bids, creative, and audiences inside one platform and is owned by a channel specialist. Cross-channel optimization moves budget between channels based on where the next dollar earns the highest incremental return. It requires a unified measurement layer that sits above any individual platform's reporting.
Why is platform-reported ROAS unreliable for budget allocation?
Every ad platform counts conversions using its own attribution window and methodology. When you sum the conversions each platform claims, the total regularly exceeds actual conversions by 30% or more. Marketing mix modeling and incrementality testing provide an independent, causal view of which channels truly drive lift rather than take credit for it.
What is a diminishing returns curve and why does it matter?
A diminishing returns curve shows how each additional dollar spent in a channel produces progressively less incremental revenue. Most channels hit a point where spend continues to rise but return flattens. Knowing where that knee sits for each channel is what allows a marketing team to shift budget from saturated channels to those still climbing.
How often should marketing budgets be reallocated across channels?
Static quarterly or annual plans cannot keep pace with platform auctions, seasonality, or competitive shifts. A rolling four-week allocation cycle, guided by weekly MMM updates, lets teams respond to real conditions. The guardrails are a minimum spend floor for always-on channels and a ceiling for any channel whose marginal ROI curve is flattening.
What is the minimum a team needs to start cross-channel optimization?
Three things: a cross-channel audit covering the last six to twelve months of spend and performance by channel, one geographic holdout test to establish a causal baseline for a pivotal channel, and a lightweight marketing mix model built on the same data. That combination gives a team the marginal ROI curves needed to make the first reallocation decision.

