How beehiiv Cracked the OOH Measurement Code (~100K Users Proven)
BlueAlpha's OOH measurement proved beehiiv's $300K NYC subway campaign drove ~100,000 incremental users at ~$4 each via geo holdout, 95% confidence.

Incrementality Proven

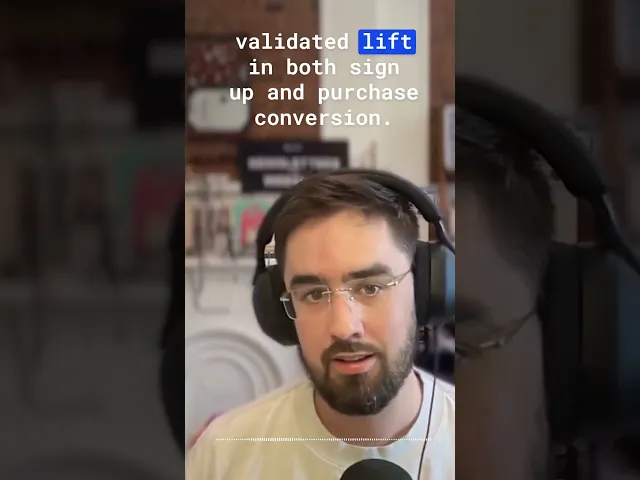
"Nobody has ever been able to do that before. Everyone has anecdotal stuff like 'people said they heard about us on the subway,' but no one has been able to show us that it actually worked. It drove an increase in actual performance."


EJ White Former Head of Growth at Beehiiv
BlueAlpha ran the first statistically validated measurement of beehiiv's $300,000 New York City subway advertising campaign using a geo holdout design and Bayesian structural time series (BSTS) modeling. The test detected approximately 100,000 incremental new website users attributable to the subway ads at a cost of roughly $4 per incremental visitor, with 95% statistical confidence. The analysis also measured signup and purchase-level impact, giving beehiiv the data to make a go/no-go decision on future OOH investment.
beehiiv Invested $300K in NYC Subway Advertising
beehiiv is a newsletter platform that was running 30+ campaigns across 5+ digital channels at the time of this engagement. The company had invested $300,000 in a New York City subway advertising campaign. The ads generated visible buzz: people texted the team about seeing the ads, social mentions spiked, and the brand felt more present in its core market.
The question was whether any of that translated into measurable business impact.
No Measurement Tool Could Prove OOH Worked
Standard measurement tools were blind to OOH:
Platform metrics do not exist for subway ads.
Surveys captured anecdotal recall ("I saw your ad on the subway") but could not quantify incremental business impact.
Multi-touch models cannot track offline exposure.
A traditional MMM refresh would take months and could not isolate the campaign-specific impact within the required timeframe.
beehiiv needed an answer within weeks, not quarters, to decide whether to scale OOH to other markets or reallocate the budget back to digital.
BlueAlpha's Approach
BlueAlpha designed a geo-based causal measurement study using New York City as the treatment geography and comparable cities as control markets.
Phase 1: Experiment design (1 week pre-campaign)
BlueAlpha established New York City as the treatment region and identified control markets with similar baseline traffic, signup, and purchase characteristics. Predictive models were built to forecast expected performance in the absence of OOH advertising. Real-time data pipelines were set up for GA4 new user tracking, signup events, and purchase events.
Phase 2: Live campaign monitoring
During the four-week campaign and the subsequent observation window, BlueAlpha captured daily data across treatment and control regions. Weekly variance analysis detected early signals. Anomaly detection flagged potential confounding factors (seasonal effects, concurrent digital campaigns, external events).
Phase 3: Causal impact analysis (post-campaign)
BlueAlpha applied Bayesian structural time series (BSTS) modeling to quantify the causal impact of the subway campaign at each funnel stage. A synthetic control method provided validation. Incrementality was calculated with confidence intervals at each level.
OOH Measurement Results: ~100K Users at ~$4 Each
Funnel Stage | Incremental Impact | Cost per Incremental Unit | Confidence |
|---|---|---|---|
New website users | ~100,000 incremental new users | ~$4 per user | 95% |
Free signups | 100+ incremental signups | ~$2,700 per signup | 95% |
Paid-plan purchases (net new) | 15-20 incremental purchases | ~$17,000 per purchase | 95% |
The funnel analysis revealed a steep drop-off from OOH-driven awareness to conversion. The subway ads generated massive top-of-funnel traffic at an efficient cost per visitor (~$4), but conversion to signups was roughly 5x more expensive than beehiiv's digital acquisition baseline, and the path to paid-plan purchases was steeper still.
Revenue impact. At beehiiv's LTV of $1,250 per net new purchase, the 15-20 incremental purchases generated approximately $19,000-$25,000 in lifetime customer value against the $300,000 investment. OOH at this scale and creative treatment was a brand awareness driver with strong traffic economics, not a direct-response acquisition channel. The ~100,000 incremental visitors at ~$4 each validated that subway ads drove genuine digital engagement at scale; the conversion funnel from visitor to paying subscriber is where the economics narrow.
OOH Positioned as Brand Investment, Search Lift Test Next
The data enabled four concrete decisions:
OOH budget was positioned as a brand investment, not a performance channel. The ~100,000 incremental visitors confirmed that subway ads drove genuine awareness at scale. The steep conversion funnel from visitor to signup to purchase meant that OOH's economic case rested on awareness value and long-term brand effects, not on direct CPA economics. beehiiv could now defend OOH spend to its board using causal data rather than anecdote, while keeping performance budget allocated to channels with proven direct-response economics (TikTok, YouTube, Meta).
Future OOH testing was structured with clear success criteria. With a validated measurement capability, beehiiv could test OOH in other markets using the same geo holdout framework. Each new market would have its own treatment/control setup, pre-set success thresholds, and a decision rule for scaling or cutting.
The measurement methodology became reusable. The geo holdout + BSTS approach that BlueAlpha deployed for this subway campaign applies to any offline or hard-to-measure channel: billboards, transit ads, TV, direct mail, podcast sponsorships. beehiiv gained a measurement playbook, not just a one-time result.
A follow-up campaign was designed around upper-funnel KPIs. The first test measured OOH against bottom-funnel conversion metrics (signups, purchases), where the steep funnel made direct-response economics unfavorable. BlueAlpha recommended launching an additional OOH campaign measured against upper-funnel KPIs that better match what brand advertising actually drives: search lift (branded query volume increase in the treatment geography) and direct traffic increase (users typing beehiiv.com directly, a proxy for unaided awareness). These metrics capture the awareness-to-intent bridge that bottom-funnel conversion tracking misses, and they align with how the ~100,000 incremental visitors actually entered beehiiv's ecosystem.
As EJ White noted on the Numbers and Narratives Podcast:
"Brandformance is the hot word these days, but nobody has ever been able to show actual performance lift from brand campaigns. We were able to show statistically valid proof."

Ready to measure your offline and hard-to-track channels with the same rigor? Book a strategy call to discuss how geo holdout incrementality tests can quantify OOH, CTV, direct mail, and other channels that platform metrics can't reach.

"Nobody has ever been able to do that before. Everyone has anecdotal stuff like 'people said they heard about us on the subway,' but no one has been able to show us that it actually worked. It drove an increase in actual performance."

EJ White Former Head of Growth at Beehiiv
BlueAlpha ran the first statistically validated measurement of beehiiv's $300,000 New York City subway advertising campaign using a geo holdout design and Bayesian structural time series (BSTS) modeling. The test detected approximately 100,000 incremental new website users attributable to the subway ads at a cost of roughly $4 per incremental visitor, with 95% statistical confidence. The analysis also measured signup and purchase-level impact, giving beehiiv the data to make a go/no-go decision on future OOH investment.
beehiiv Invested $300K in NYC Subway Advertising
beehiiv is a newsletter platform that was running 30+ campaigns across 5+ digital channels at the time of this engagement. The company had invested $300,000 in a New York City subway advertising campaign. The ads generated visible buzz: people texted the team about seeing the ads, social mentions spiked, and the brand felt more present in its core market.
The question was whether any of that translated into measurable business impact.
No Measurement Tool Could Prove OOH Worked
Standard measurement tools were blind to OOH:
Platform metrics do not exist for subway ads.
Surveys captured anecdotal recall ("I saw your ad on the subway") but could not quantify incremental business impact.
Multi-touch models cannot track offline exposure.
A traditional MMM refresh would take months and could not isolate the campaign-specific impact within the required timeframe.
beehiiv needed an answer within weeks, not quarters, to decide whether to scale OOH to other markets or reallocate the budget back to digital.
BlueAlpha's Approach
BlueAlpha designed a geo-based causal measurement study using New York City as the treatment geography and comparable cities as control markets.
Phase 1: Experiment design (1 week pre-campaign)
BlueAlpha established New York City as the treatment region and identified control markets with similar baseline traffic, signup, and purchase characteristics. Predictive models were built to forecast expected performance in the absence of OOH advertising. Real-time data pipelines were set up for GA4 new user tracking, signup events, and purchase events.
Phase 2: Live campaign monitoring
During the four-week campaign and the subsequent observation window, BlueAlpha captured daily data across treatment and control regions. Weekly variance analysis detected early signals. Anomaly detection flagged potential confounding factors (seasonal effects, concurrent digital campaigns, external events).
Phase 3: Causal impact analysis (post-campaign)
BlueAlpha applied Bayesian structural time series (BSTS) modeling to quantify the causal impact of the subway campaign at each funnel stage. A synthetic control method provided validation. Incrementality was calculated with confidence intervals at each level.
OOH Measurement Results: ~100K Users at ~$4 Each
Funnel Stage | Incremental Impact | Cost per Incremental Unit | Confidence |
|---|---|---|---|
New website users | ~100,000 incremental new users | ~$4 per user | 95% |
Free signups | 100+ incremental signups | ~$2,700 per signup | 95% |
Paid-plan purchases (net new) | 15-20 incremental purchases | ~$17,000 per purchase | 95% |
The funnel analysis revealed a steep drop-off from OOH-driven awareness to conversion. The subway ads generated massive top-of-funnel traffic at an efficient cost per visitor (~$4), but conversion to signups was roughly 5x more expensive than beehiiv's digital acquisition baseline, and the path to paid-plan purchases was steeper still.
Revenue impact. At beehiiv's LTV of $1,250 per net new purchase, the 15-20 incremental purchases generated approximately $19,000-$25,000 in lifetime customer value against the $300,000 investment. OOH at this scale and creative treatment was a brand awareness driver with strong traffic economics, not a direct-response acquisition channel. The ~100,000 incremental visitors at ~$4 each validated that subway ads drove genuine digital engagement at scale; the conversion funnel from visitor to paying subscriber is where the economics narrow.
OOH Positioned as Brand Investment, Search Lift Test Next
The data enabled four concrete decisions:
OOH budget was positioned as a brand investment, not a performance channel. The ~100,000 incremental visitors confirmed that subway ads drove genuine awareness at scale. The steep conversion funnel from visitor to signup to purchase meant that OOH's economic case rested on awareness value and long-term brand effects, not on direct CPA economics. beehiiv could now defend OOH spend to its board using causal data rather than anecdote, while keeping performance budget allocated to channels with proven direct-response economics (TikTok, YouTube, Meta).
Future OOH testing was structured with clear success criteria. With a validated measurement capability, beehiiv could test OOH in other markets using the same geo holdout framework. Each new market would have its own treatment/control setup, pre-set success thresholds, and a decision rule for scaling or cutting.
The measurement methodology became reusable. The geo holdout + BSTS approach that BlueAlpha deployed for this subway campaign applies to any offline or hard-to-measure channel: billboards, transit ads, TV, direct mail, podcast sponsorships. beehiiv gained a measurement playbook, not just a one-time result.
A follow-up campaign was designed around upper-funnel KPIs. The first test measured OOH against bottom-funnel conversion metrics (signups, purchases), where the steep funnel made direct-response economics unfavorable. BlueAlpha recommended launching an additional OOH campaign measured against upper-funnel KPIs that better match what brand advertising actually drives: search lift (branded query volume increase in the treatment geography) and direct traffic increase (users typing beehiiv.com directly, a proxy for unaided awareness). These metrics capture the awareness-to-intent bridge that bottom-funnel conversion tracking misses, and they align with how the ~100,000 incremental visitors actually entered beehiiv's ecosystem.
As EJ White noted on the Numbers and Narratives Podcast:
"Brandformance is the hot word these days, but nobody has ever been able to show actual performance lift from brand campaigns. We were able to show statistically valid proof."

Ready to measure your offline and hard-to-track channels with the same rigor? Book a strategy call to discuss how geo holdout incrementality tests can quantify OOH, CTV, direct mail, and other channels that platform metrics can't reach.
