MUBI Knew Paid Was Undercounted. Now Finance Can Prove It.
BlueAlpha's weekly Bayesian MMM proved MUBI's paid media drives 1.5x the conversions last-touch credited. Finance is migrating its reporting onto the model.

Incrementality Proven

We knew paid was doing more than ad platforms were giving credit for. We just couldn't prove it. BlueAlpha built and validated the models across our global business in four weeks, faster than we could have hired for it, let alone built it.

Rory Japp VP of Digital Marketing, MUBI
MUBI had planned its marketing budget on platform-reported numbers for years. BlueAlpha shipped a new Bayesian marketing mix model every week and back-tested it against what actually happened. Once finance had enough evidence, it began moving the basis of its own reporting onto the model. That migration is underway now, and the model measured paid media driving roughly 1.5x the conversions last-touch had been crediting it with.
MUBI Runs Global Arthouse Streaming on Title-Driven Signups
MUBI is a curation-led streaming service. Most platforms compete on catalogue size. MUBI competes on selection: a rotating, hand-picked program of arthouse, independent and classic film alongside a theatrical release business. It operates across a large number of markets with a lean marketing team.
That shapes how people subscribe. Members sign up because they are drawn in by a specific title, and they take their time about it. Someone sees an ad for a film, does nothing, thinks about it, comes back days later through search or directly or on another device, starts a trial, and then watches something else entirely.
Every measurement problem in this case study follows from that one pattern.
The Budget Number MUBI Couldn't Defend to Finance
The marketing team already suspected the problem. Their own description of it, before any model existed, was duplication, double counting and under reporting across platform numbers. They could see it. They could not prove it, and a number you cannot prove is a number you cannot act on.
This is the trap most marketing budgets sit in. The budget gets built bottom-up from assumed channel contributions, every one of which rests on platform reporting. So you allocate on the most defensible guess, defend it on instinct, and find out whether you were right too late to do anything about it. That is running a budget like a project manager, justifying the next step. A portfolio manager moves money to where it pays off, which requires knowing what actually pays off.
The error runs one way. Platforms undercount the channels that do not earn a last click, so the rational response to bad measurement is to underfund what works, and it gets called discipline.
Why Last-Touch Undercounts Paid for Title-Driven Signups
The easy story is that platforms undercount because of privacy: GDPR consent, iOS, cookie loss. That is real, and it is worst in Europe. It is also only half of what was happening at MUBI, and on its own, a skeptical CMO can wave it away as a measurement artifact.
The bigger reason is the customer journey itself. MUBI's signups are title-driven and considered, so the touch that actually drove the decision was rarely a last click. It was influence: a view, a consideration nudge, a reason to come back. Last-touch can only credit the final trackable click. It structurally cannot see influence, even in a market with perfect tracking and full consent.
This is not a MUBI quirk. Any considered-purchase or content business with a think-and-return pattern has its own version of it. Privacy-driven signal loss almost certainly widens the gap on top of this. We measured the total gap rather than assigning a share to any one cause.
Figure 1. Reported versus measured paid contribution, indexed
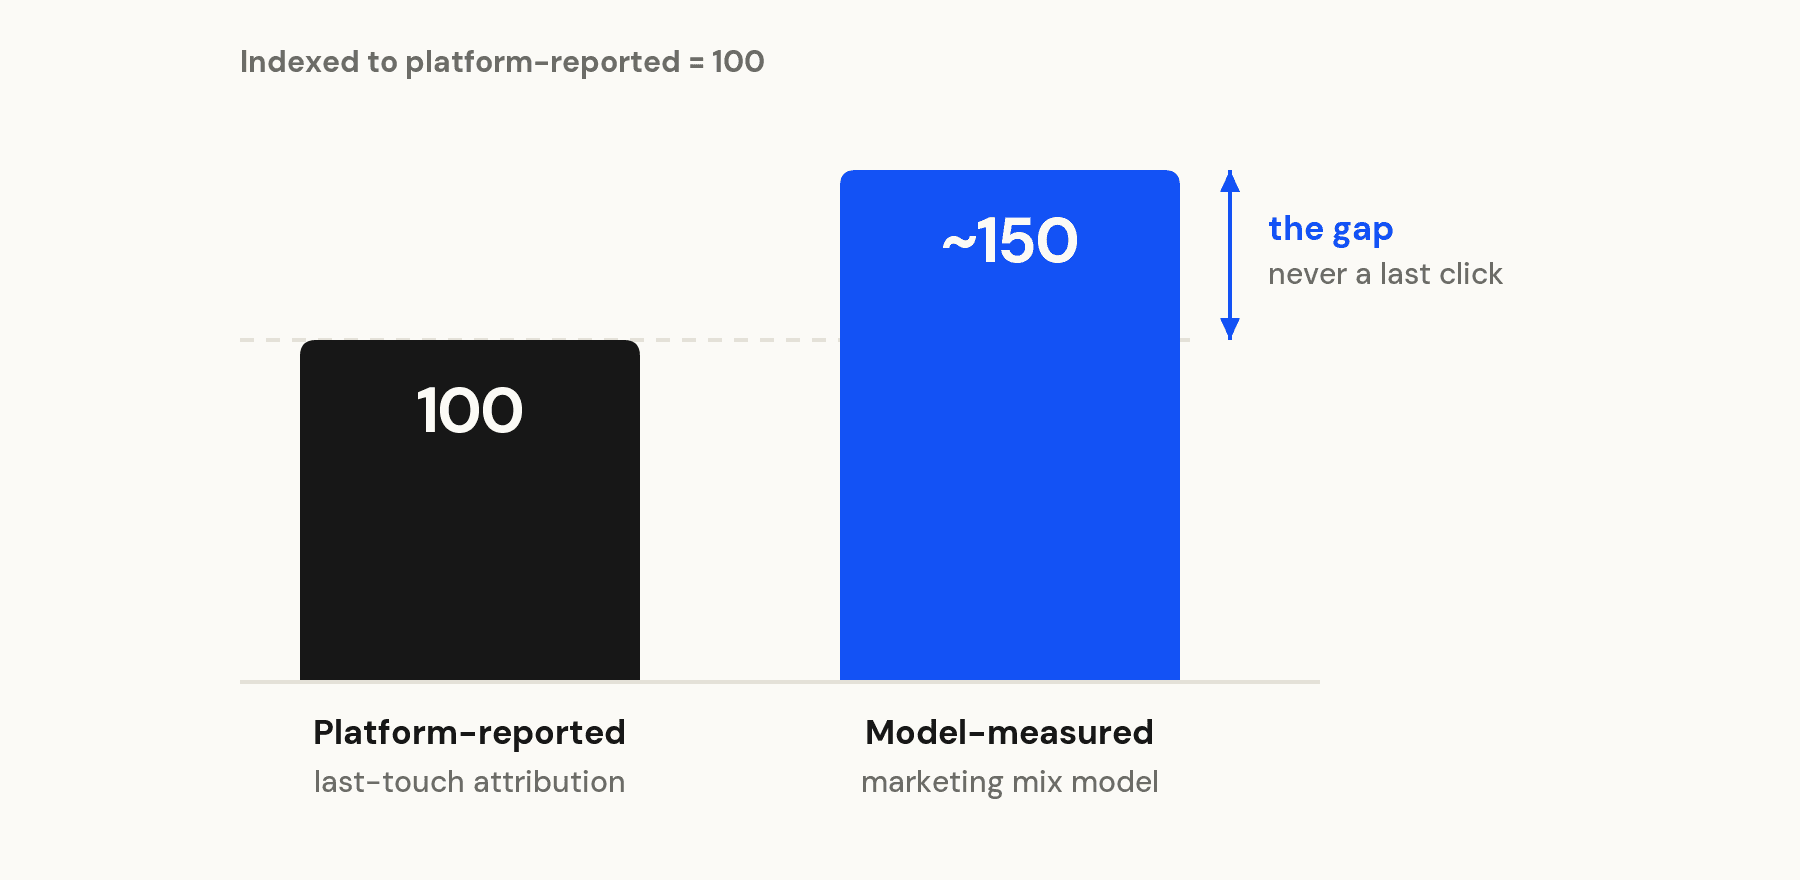
Sizing the gap: what platforms credit to paid, versus what the model measures paid actually drives, indexed to reported.
That distinction changes what is being claimed. We are not saying the model found hidden clicks the platforms missed. We are saying last-touch was never capable of measuring influence that does not end in a click. That is a definitional limit of the method rather than a modeling opinion, and it is why the gap represents real growth rather than a reporting footnote.
BlueAlpha's Approach: Four Steps From Workshop to Weekly Model
The hard part of this work is not producing a number. It is getting a finance team that has always planned on platform metrics to stake its budget on a model instead. That is a change management problem wearing a measurement problem's clothes, and we ran it in a deliberate order.
Step 1: Settle the method before judging any number
Before building anything, we ran a workshop with MUBI's CMO and finance team on a single question. Given how MUBI's customers actually behave, is a marketing mix model a better way to measure marketing's true impact on the business than platform metrics?
The answer is not universal. It depends on the customer journey. For a curation-led business with a considered, title-driven signup, it is clearly yes. Settling that up front meant the methodology debate was over before any numbers arrived. Everything afterwards was about accuracy, not about whether the approach was valid.
Step 2: Ship one model a week and back-test every read
Agreeing that a marketing mix model is the right lens does not make any single model trustworthy. That takes discipline in four places. First, a deliberate retraining cadence. Second, being explicit about what the model optimizes for. Third, holding accuracy and robustness together rather than trading one against the other. Fourth, continuous back-testing, which proves the model predicts reality rather than fitting the past.
We shipped one Bayesian hierarchical model every week, embedded with the team, with channel-specific adstock and saturation curves and dynamic priors. Across the engagement the models held an average three-week-ahead backtesting accuracy of 93.8%. Backtesting means the model was scored on data it had never seen, so the read was not just plausible. It was demonstrably predictive.
Step 3: Move internal reporting onto the model
Each week's results went back to finance and leadership, so trust compounded from repeated evidence rather than a single pitch. Once it had, MUBI began migrating its internal reporting onto the model. The budget read is shifting from platform last-touch to the model.
This is the step that matters most and the one measurement projects most often fail at. A model nobody plans on is a report, not a decision.
Step 4: Operationalize the read into weekly decisions
The next step is embedding the read into MUBI's day-to-day decisions, through the allocation engine built around the models. The number stops being something finance reviews and becomes the thing that moves spend.
The sequence is the point: method first, empirical proof second, migrating the number third, operational decisions fourth. Most measurement pitches try to win on step three with a dramatic statistic. We de-risked the whole thing by settling "is this even the right way to measure" in a room with the CMO and finance team. Not a single model was judged on its output until that question was answered.
Figure 2. The sequence that let finance move
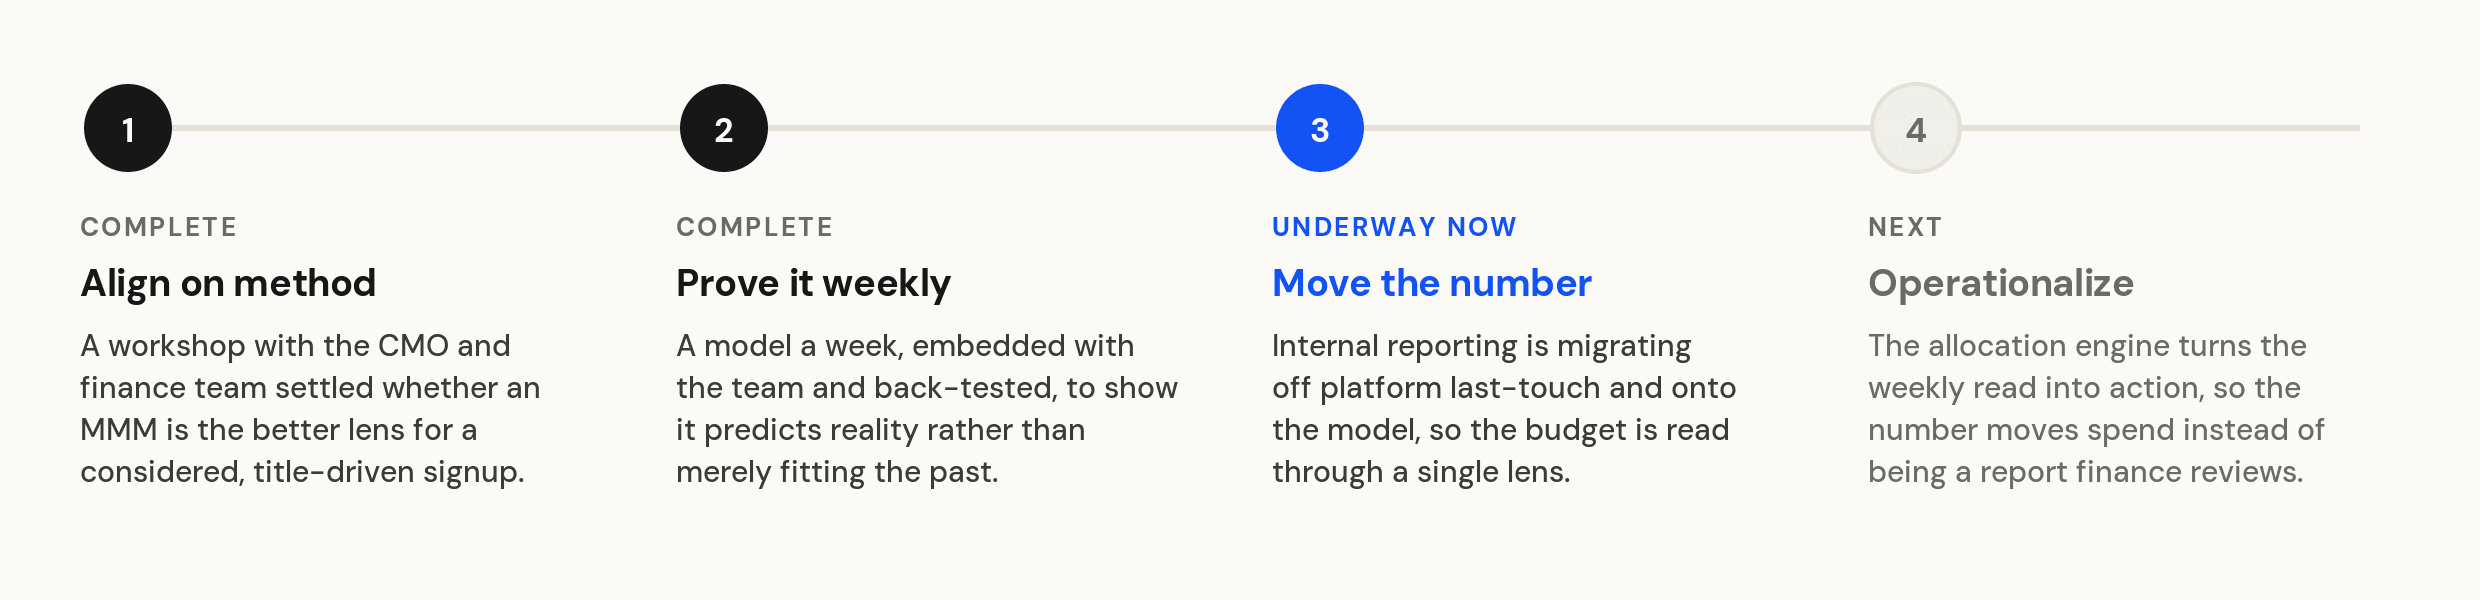
The order that let finance move: align on method, prove it weekly, move the numbers over, operationalize, then run it as a continuous loop.
Results: What the Marketing Mix Model Measured, What Finance Did
Causal measurement showed paid media driving roughly 1.5x the conversions last-touch had been crediting it with, where a conversion is MUBI's purchase event: a trial start with card details entered.
The model covered Meta, Google, YouTube and Apple Search Ads across MUBI's North American buy.
Metric | Platform-reported | Measured | Gap |
|---|---|---|---|
Paid-driven conversions | 100 | ~150 | +50% |
Cost per conversion | 100 | ~67 | -33% |
Indexed to platform-reported at 100. MUBI's absolute volumes and spend levels are not disclosed.
Because paid drove roughly 1.5x more conversions on the same spend, the true cost per conversion (CPA in MUBI's terms) was about a third lower than the platforms reported. That is one finding and its arithmetic consequence rather than two separate results.
Organic's share of acquisition came down and paid's went up, because the model reassigned to paid the influence that last-touch had been silently handing to organic and direct. The shift was large enough to change how the budget gets planned. The efficiency story inverted with it: the channel finance had treated as its most expensive turned out to be among its most efficient.
The number is only half the result. MUBI is migrating its internal reporting onto the model, and that is not a decision a finance function makes about a model it is unsure of. It is the outcome we would point to first.
What Happened Next: Incrementality Testing and CTV Measurement
The migration is the foundation rather than the finish.
Incrementality testing is the next phase. The marketing mix model gives the read; a geo holdout proves it. With the method validated and the numbers moving over, the natural next step is testing specific channels and the upper funnel. That includes bets like Connected TV, frozen until now because they could not be measured cleanly. Scaling decisions then rest on causal proof rather than model estimate alone.
Operational decision-making is the other next phase. The allocation engine turns the weekly read into action. Reporting runs itself. Signals like creative fatigue and competitive moves flag when to act. Deployment-ready recommendations feed into the ad platforms. The quarterly measure-and-react cycle becomes a continuous loop.
North America is only the start. The same system extends across every market MUBI operates in. It also extends up the whole budget, into brand, promotions and theatrical. Those are the parts of the mix that have always been hardest to measure and easiest to over- or under-fund.
Key Takeaways for Streaming and Subscription Businesses
If your signups are title-driven or content-driven, last-touch is undercounting paid by construction. The cause is not tracking loss alone. It is that the touch which drove the decision does not end in a click, so no last-touch system can see it.
Getting the number is the easy half. A model your finance team does not plan on has changed nothing. Sequence the method agreement before the model, and the empirical proof before the migration.
Weekly beats quarterly, and back-testing beats fit. A model refreshed once a quarter cannot build trust through repetition, and in-sample fit tells you nothing about whether a model predicts.
Trial-start economics and subscriber economics are different problems. Measure the event you optimize toward, then measure what happens downstream of it. Conflating the two hides where the money actually goes.
See What Your Own Marketing Budget Actually Drives
If your budget is planned bottom-up on assumed contributions that rest on platform reporting, you are probably underfunding what works and calling it discipline. The fix is not a better tool for one channel. It is measuring what actually drives growth and running the whole budget like a portfolio. Paid is just where the proof starts.

We knew paid was doing more than ad platforms were giving credit for. We just couldn't prove it. BlueAlpha built and validated the models across our global business in four weeks, faster than we could have hired for it, let alone built it.

Rory Japp VP of Digital Marketing, MUBI
MUBI had planned its marketing budget on platform-reported numbers for years. BlueAlpha shipped a new Bayesian marketing mix model every week and back-tested it against what actually happened. Once finance had enough evidence, it began moving the basis of its own reporting onto the model. That migration is underway now, and the model measured paid media driving roughly 1.5x the conversions last-touch had been crediting it with.
MUBI Runs Global Arthouse Streaming on Title-Driven Signups
MUBI is a curation-led streaming service. Most platforms compete on catalogue size. MUBI competes on selection: a rotating, hand-picked program of arthouse, independent and classic film alongside a theatrical release business. It operates across a large number of markets with a lean marketing team.
That shapes how people subscribe. Members sign up because they are drawn in by a specific title, and they take their time about it. Someone sees an ad for a film, does nothing, thinks about it, comes back days later through search or directly or on another device, starts a trial, and then watches something else entirely.
Every measurement problem in this case study follows from that one pattern.
The Budget Number MUBI Couldn't Defend to Finance
The marketing team already suspected the problem. Their own description of it, before any model existed, was duplication, double counting and under reporting across platform numbers. They could see it. They could not prove it, and a number you cannot prove is a number you cannot act on.
This is the trap most marketing budgets sit in. The budget gets built bottom-up from assumed channel contributions, every one of which rests on platform reporting. So you allocate on the most defensible guess, defend it on instinct, and find out whether you were right too late to do anything about it. That is running a budget like a project manager, justifying the next step. A portfolio manager moves money to where it pays off, which requires knowing what actually pays off.
The error runs one way. Platforms undercount the channels that do not earn a last click, so the rational response to bad measurement is to underfund what works, and it gets called discipline.
Why Last-Touch Undercounts Paid for Title-Driven Signups
The easy story is that platforms undercount because of privacy: GDPR consent, iOS, cookie loss. That is real, and it is worst in Europe. It is also only half of what was happening at MUBI, and on its own, a skeptical CMO can wave it away as a measurement artifact.
The bigger reason is the customer journey itself. MUBI's signups are title-driven and considered, so the touch that actually drove the decision was rarely a last click. It was influence: a view, a consideration nudge, a reason to come back. Last-touch can only credit the final trackable click. It structurally cannot see influence, even in a market with perfect tracking and full consent.
This is not a MUBI quirk. Any considered-purchase or content business with a think-and-return pattern has its own version of it. Privacy-driven signal loss almost certainly widens the gap on top of this. We measured the total gap rather than assigning a share to any one cause.
Figure 1. Reported versus measured paid contribution, indexed

Sizing the gap: what platforms credit to paid, versus what the model measures paid actually drives, indexed to reported.
That distinction changes what is being claimed. We are not saying the model found hidden clicks the platforms missed. We are saying last-touch was never capable of measuring influence that does not end in a click. That is a definitional limit of the method rather than a modeling opinion, and it is why the gap represents real growth rather than a reporting footnote.
BlueAlpha's Approach: Four Steps From Workshop to Weekly Model
The hard part of this work is not producing a number. It is getting a finance team that has always planned on platform metrics to stake its budget on a model instead. That is a change management problem wearing a measurement problem's clothes, and we ran it in a deliberate order.
Step 1: Settle the method before judging any number
Before building anything, we ran a workshop with MUBI's CMO and finance team on a single question. Given how MUBI's customers actually behave, is a marketing mix model a better way to measure marketing's true impact on the business than platform metrics?
The answer is not universal. It depends on the customer journey. For a curation-led business with a considered, title-driven signup, it is clearly yes. Settling that up front meant the methodology debate was over before any numbers arrived. Everything afterwards was about accuracy, not about whether the approach was valid.
Step 2: Ship one model a week and back-test every read
Agreeing that a marketing mix model is the right lens does not make any single model trustworthy. That takes discipline in four places. First, a deliberate retraining cadence. Second, being explicit about what the model optimizes for. Third, holding accuracy and robustness together rather than trading one against the other. Fourth, continuous back-testing, which proves the model predicts reality rather than fitting the past.
We shipped one Bayesian hierarchical model every week, embedded with the team, with channel-specific adstock and saturation curves and dynamic priors. Across the engagement the models held an average three-week-ahead backtesting accuracy of 93.8%. Backtesting means the model was scored on data it had never seen, so the read was not just plausible. It was demonstrably predictive.
Step 3: Move internal reporting onto the model
Each week's results went back to finance and leadership, so trust compounded from repeated evidence rather than a single pitch. Once it had, MUBI began migrating its internal reporting onto the model. The budget read is shifting from platform last-touch to the model.
This is the step that matters most and the one measurement projects most often fail at. A model nobody plans on is a report, not a decision.
Step 4: Operationalize the read into weekly decisions
The next step is embedding the read into MUBI's day-to-day decisions, through the allocation engine built around the models. The number stops being something finance reviews and becomes the thing that moves spend.
The sequence is the point: method first, empirical proof second, migrating the number third, operational decisions fourth. Most measurement pitches try to win on step three with a dramatic statistic. We de-risked the whole thing by settling "is this even the right way to measure" in a room with the CMO and finance team. Not a single model was judged on its output until that question was answered.
Figure 2. The sequence that let finance move

The order that let finance move: align on method, prove it weekly, move the numbers over, operationalize, then run it as a continuous loop.
Results: What the Marketing Mix Model Measured, What Finance Did
Causal measurement showed paid media driving roughly 1.5x the conversions last-touch had been crediting it with, where a conversion is MUBI's purchase event: a trial start with card details entered.
The model covered Meta, Google, YouTube and Apple Search Ads across MUBI's North American buy.
Metric | Platform-reported | Measured | Gap |
|---|---|---|---|
Paid-driven conversions | 100 | ~150 | +50% |
Cost per conversion | 100 | ~67 | -33% |
Indexed to platform-reported at 100. MUBI's absolute volumes and spend levels are not disclosed.
Because paid drove roughly 1.5x more conversions on the same spend, the true cost per conversion (CPA in MUBI's terms) was about a third lower than the platforms reported. That is one finding and its arithmetic consequence rather than two separate results.
Organic's share of acquisition came down and paid's went up, because the model reassigned to paid the influence that last-touch had been silently handing to organic and direct. The shift was large enough to change how the budget gets planned. The efficiency story inverted with it: the channel finance had treated as its most expensive turned out to be among its most efficient.
The number is only half the result. MUBI is migrating its internal reporting onto the model, and that is not a decision a finance function makes about a model it is unsure of. It is the outcome we would point to first.
What Happened Next: Incrementality Testing and CTV Measurement
The migration is the foundation rather than the finish.
Incrementality testing is the next phase. The marketing mix model gives the read; a geo holdout proves it. With the method validated and the numbers moving over, the natural next step is testing specific channels and the upper funnel. That includes bets like Connected TV, frozen until now because they could not be measured cleanly. Scaling decisions then rest on causal proof rather than model estimate alone.
Operational decision-making is the other next phase. The allocation engine turns the weekly read into action. Reporting runs itself. Signals like creative fatigue and competitive moves flag when to act. Deployment-ready recommendations feed into the ad platforms. The quarterly measure-and-react cycle becomes a continuous loop.
North America is only the start. The same system extends across every market MUBI operates in. It also extends up the whole budget, into brand, promotions and theatrical. Those are the parts of the mix that have always been hardest to measure and easiest to over- or under-fund.
Key Takeaways for Streaming and Subscription Businesses
If your signups are title-driven or content-driven, last-touch is undercounting paid by construction. The cause is not tracking loss alone. It is that the touch which drove the decision does not end in a click, so no last-touch system can see it.
Getting the number is the easy half. A model your finance team does not plan on has changed nothing. Sequence the method agreement before the model, and the empirical proof before the migration.
Weekly beats quarterly, and back-testing beats fit. A model refreshed once a quarter cannot build trust through repetition, and in-sample fit tells you nothing about whether a model predicts.
Trial-start economics and subscriber economics are different problems. Measure the event you optimize toward, then measure what happens downstream of it. Conflating the two hides where the money actually goes.
See What Your Own Marketing Budget Actually Drives
If your budget is planned bottom-up on assumed contributions that rest on platform reporting, you are probably underfunding what works and calling it discipline. The fix is not a better tool for one channel. It is measuring what actually drives growth and running the whole budget like a portfolio. Paid is just where the proof starts.
