
Winning Market Share in Consumer AI SaaS (2026-2027)
A CFO-proof growth system for Consumer AI companies: incrementality-first MMM, GeoLift, and 10+ tests per week
Growth Programs

Why This Playbook Exists
This guide is for Directors and VPs of Marketing / Growth building consumer-facing AI SaaS.
Funding is tightening, model launches arrive monthly, and a single bad attribution call can vaporize half this quarter’s budget. Boards still ask for market-share stories, yet the numbers that justify spend live in five ad dashboards, three product tools, and a spreadsheet no one trusts.
This playbook equips you to turn that mess into a repeatable growth engine. You will learn how to:
Translate marketing signals into finance-ready language so the investors and the CFO can green-light bigger bets.
Diagnose and fix attribution and channel cannibalization with MMMs and incrementality tests, ending the guesswork about which half of the ad budget is wasted.
Run 10+ experiments each week without drowning in data sprawl, then scale only the touches that are provably incremental.
It draws on real benchmarks, live examples, and BlueAlpha’s first-principles measurement framework, letting you spend with confidence today and compound gains through 2027.
The “Why Now” Moment
Funding is melting into a few giants. Q1 2025 broke records with $66.6 billion flowing into AI, yet 79% of that capital sat in mega-rounds at infra vendors, leaving consumer apps to scrap for the rest.
New entrants flood the shelves. Seventeen fresh web products cracked a16z’s Top 100 Gen-AI list in just six months.
User expectations leap each model cycle. ChatGPT doubled from 200M to 400M weekly actives in under six months after GPT-4o voice rolled out .
Marketing waste is compounding. Median CAC pay-back stretched past two years for average SaaS brands in 2024 (source: Bantrr).
Fail to operationalize incrementality-based growth loops now and you risk a price-warred, churn-heavy future.
Situation Analysis
Market overview
Revenue pool: Global consumer AI software will top $32 billion ARR by EoY 2026 (Menlo Ventures forecast, June 2025).
Growth: 48% CAGR 2023-2025 for consumer AI apps tracked by Similarweb in a16z Top 100.
Funding: Early-stage deal count down 30% YoY, but ticket sizes steady (median $3.8M early-stage; source: CB Insights).
Competitor heatmap (snapshot 2026)
Segment | Usage leader | Revenue leader | Moat indicator |
|---|---|---|---|
General chat | ChatGPT (400M WAU) | ChatGPT Plus | Model depth + distribution |
Multilingual chat | DeepSeek (#2 mobile MAU) | Gemini | Local language support |
Video gen / edit | VivaCut (MAU) vs. Splice (revenue) | Splice | Prosumer tooling |
Coding IDE | Cursor (hundreds of k devs) | Cursor | Enterprise data integration |
SWOT (your org)
Strengths → proprietary engagement graph; in-house model fine-tuning.
Weaknesses → single-point attribution, lacking self-serve upgrade motions.
Opportunities → niche AI agents for hobbyist creators (CB Insights sees vertical agents maturing) .
Threats → big-tech bundles eroding willingness to pay; GPU cost volatility.
Customer insights (2026 pulse check)
Who pays? Millennials (29-44) now out-consume Gen Z in daily AI usage (source: Menlo Ventures survey).
Jobs-to-be-done: accelerate learning (33%), simplify creation (30%), save time on life admin (21%); source: Attest.
Willingness to pay: 41% of frequent users say they would pay ≥$15 per month for an AI tool that saves 3 hours per week (Attest panel, Mar 2025).
Pain spikes: Onboarding cognitive load, privacy fears, inconsistent voice outputs.
Growth Leader Scorecard
Objectives, Victory Conditions & Metrics

Success Definition
You need clear finish lines so the CFO signs the cheques and the team sees progress.
Below are entry and exit criteria for each phase. A phase is only ‘done’ when it removes a pain point and advances a strategic objective. Entry and exit gates are hard numbers, not vibes. The numbers reflect 2025 consumer AI SaaS benchmarks.
Phase | Pain point resolved | Objective served | Entry gate; Exit gate | Leading metrics |
|---|---|---|---|---|
1. Discovery | Churn hidden in growth | Sticky engagement | Churn trend unknown; Top 3 churn drivers isolated | Churn driver R² > 0.7 |
2. Segmentation | Personalization debt | Sticky engagement | No personas with LTV data; JTBD + LTV personas live | LTV spread ≥ 4× |
3. Experimentation | Data sprawl & slow tests | Predictable growth | < 3 valid tests/wk; | |
0 incrementality tests/month | ≥ 10 total tests/wk (product + UX + creative) | |||
1-2 incrementality tests/month | Test velocity (all tests), GeoLift cadence, lift per incrementality test, action adoption rate | |||
4. Scale orchestration | Attribution & cannibalization | Efficient cross-channel spend | CAC pay-back >10 months; <8 months (consumer median is 4-7; source: First Page Sage) | Incremental ROAS, CAC pay-back |
5. Review & control | Resource squeeze | Healthy unit economics | No audit cycle; Quarterly Growth Audit sent | Audit on time, board NPS |
North-star metric → Net Revenue Retention (NRR); when NRR rises, you are compounding.
Supporting metrics → CAC pay-back, 90-day retention, burn multiple.
Key experimentation metrics → All-test velocity, incrementality cadence, cumulative ARR from “needle-mover” tests.
Benchmark cheat sheet
Category | Metric | Median | Top quartile |
|---|---|---|---|
Growth | CAC pay-back (consumer SaaS) | 6 months (First Page Sage) | 3 months |
Engagement | 90-day retention | 30% (Pendo.io) | 45%+ |
Efficiency | CLTV : CAC | 3.0 (Benchmarkit) | 5.0+ |
Expansion | NRR | 104% (SaaS Capital) | 118% |
Finance Lens
Pricing moves to outcome units, not seats. ElevenLabs tweaked ladders seven times in 40 days; Salesforce adopted outcome-based pricing with Agentforce’s $2 per conversation and Flex Credits models.
‘ARR + annualized usage’ replaces single ARR rows.
GPU cost per active user exposes margin leaks in real time.
Databricks feeds live telemetry into an AI forecast model, not Excel sheets.
Phases at a glance
Phase | Goal | Typical time box | Primary owner | Key output |
|---|---|---|---|---|
1. Discovery | Map demand & friction | 1-2 weeks | Growth Manager | Insight memo |
2. Segmentation | Rank personas by LTV | 2 weeks | Data Lead | Persona deck |
3. Experimentation | 10+ rapid tests per week; 1-2 incrementality tests per month | Continuous | Experiment squad | Unified test log |
4. Spend orchestration | Reallocate $ to real lift | Continuous | VP Growth | Weekly spend script |
5. Review & control | Institutionalize learnings | 2 days per quarter | VP Growth / CMO | Board deck |
Deep-Dive Instructions
Phase 1 - Discovery
Pain point addressed
Churn hidden in growth
Why it matters
You cannot optimize what you cannot name. A clear demand map focuses limited tokens and GPU cycles.
Inputs
Analytics event stream, customer interviews (10 × 15 min), refund tags.
RACI
R Data analyst; A Growth Manager; C Support lead; I VP Eng.
Steps
Export last 60 days events; run Pareto on time-to-value.
Conduct five in-app polls to capture intent; tag JTBD.
Cluster qualitative answers using thematic AI (e.g., GPT-4o) to surface JTBD; isolate top 5 churn drivers.
Present findings in 15-slide memo.
Quality checklist
At least 200 survey responses
Clusters explain 80% of churn reasons
Outputs → Insight memo, updated taxonomy.
KPIs → Survey completion, activation time delta.
Phase 2 - Segmentation
Pain point addressed
Personalization debt
Goal
Turn raw insights into monetizable personas.
Inputs
Event taxonomy, JTBD clusters, spend cohorts.
RACI
R Data science; A VP Growth; C Product design; I Support.
Broad steps
Use BlueAlpha to build a RFM (recency-frequency-monetary) table.
Layer JTBD tags.
Compute LTV distribution; flag top decile.
Draft persona pages; align each persona with messaging & value prop.
Checklist
Segments mutually exclusive & collectively exhaustive
LTV spread >4× between top and bottom quartile.
Typical duration → 2 weeks.
Outputs → Persona one-pagers.
KPIs → LTV spread, segment coverage.
Phase 3 - Experimentation
Pain point addressed
Data sprawl & slow tests
RACI
R Experiment owner; A Head of Growth; C Data science; I Legal (for privacy).
3A. Rapid-cycle tests
Goal → Find small wins fast: pricing copy, UX tweaks, creative angles.
Cadence → ≥ 10 per week.
Tooling → In-app A/B platform, feature flags.
Steps
Pull backlog ideas into a Kanban board every Monday.
Pre-register goal + MDE; design runs 1–3 days.
Deploy to 100 % when lift > 2 % and p < 0.05.
Log result in BlueAlpha test ledger.
3B. Incrementality tests (GeoLift / MMM refresh)
Goal → Answer strategic spend questions (e.g. “What is YouTube really worth after cannibalization?”)
Cadence → 1-2 tests per month (2-3 weeks runtime for each test).
Tooling → BlueAlpha GeoLift wizard + BlueAlpha Bayesian MMM.
Steps
Frame a question tied to budget action (e.g. shift 20% from Meta to TikTok).
BlueAlpha selects for you geo clusters large enough for 80% power.
Freeze other media variables in test regions to reduce confounds.
Run test 21 days; BlueAlpha updates MMM priors with lift estimate.
If incremental ROAS delta > +15%, move spend; if negative, pause.
Close the loop: document action and measured impact.
Quality checklist
No overlapping incrementality tests in adjacent DMAs.
Post-test decision written before the test starts.
Lift fed back into MMM the same day results lock.

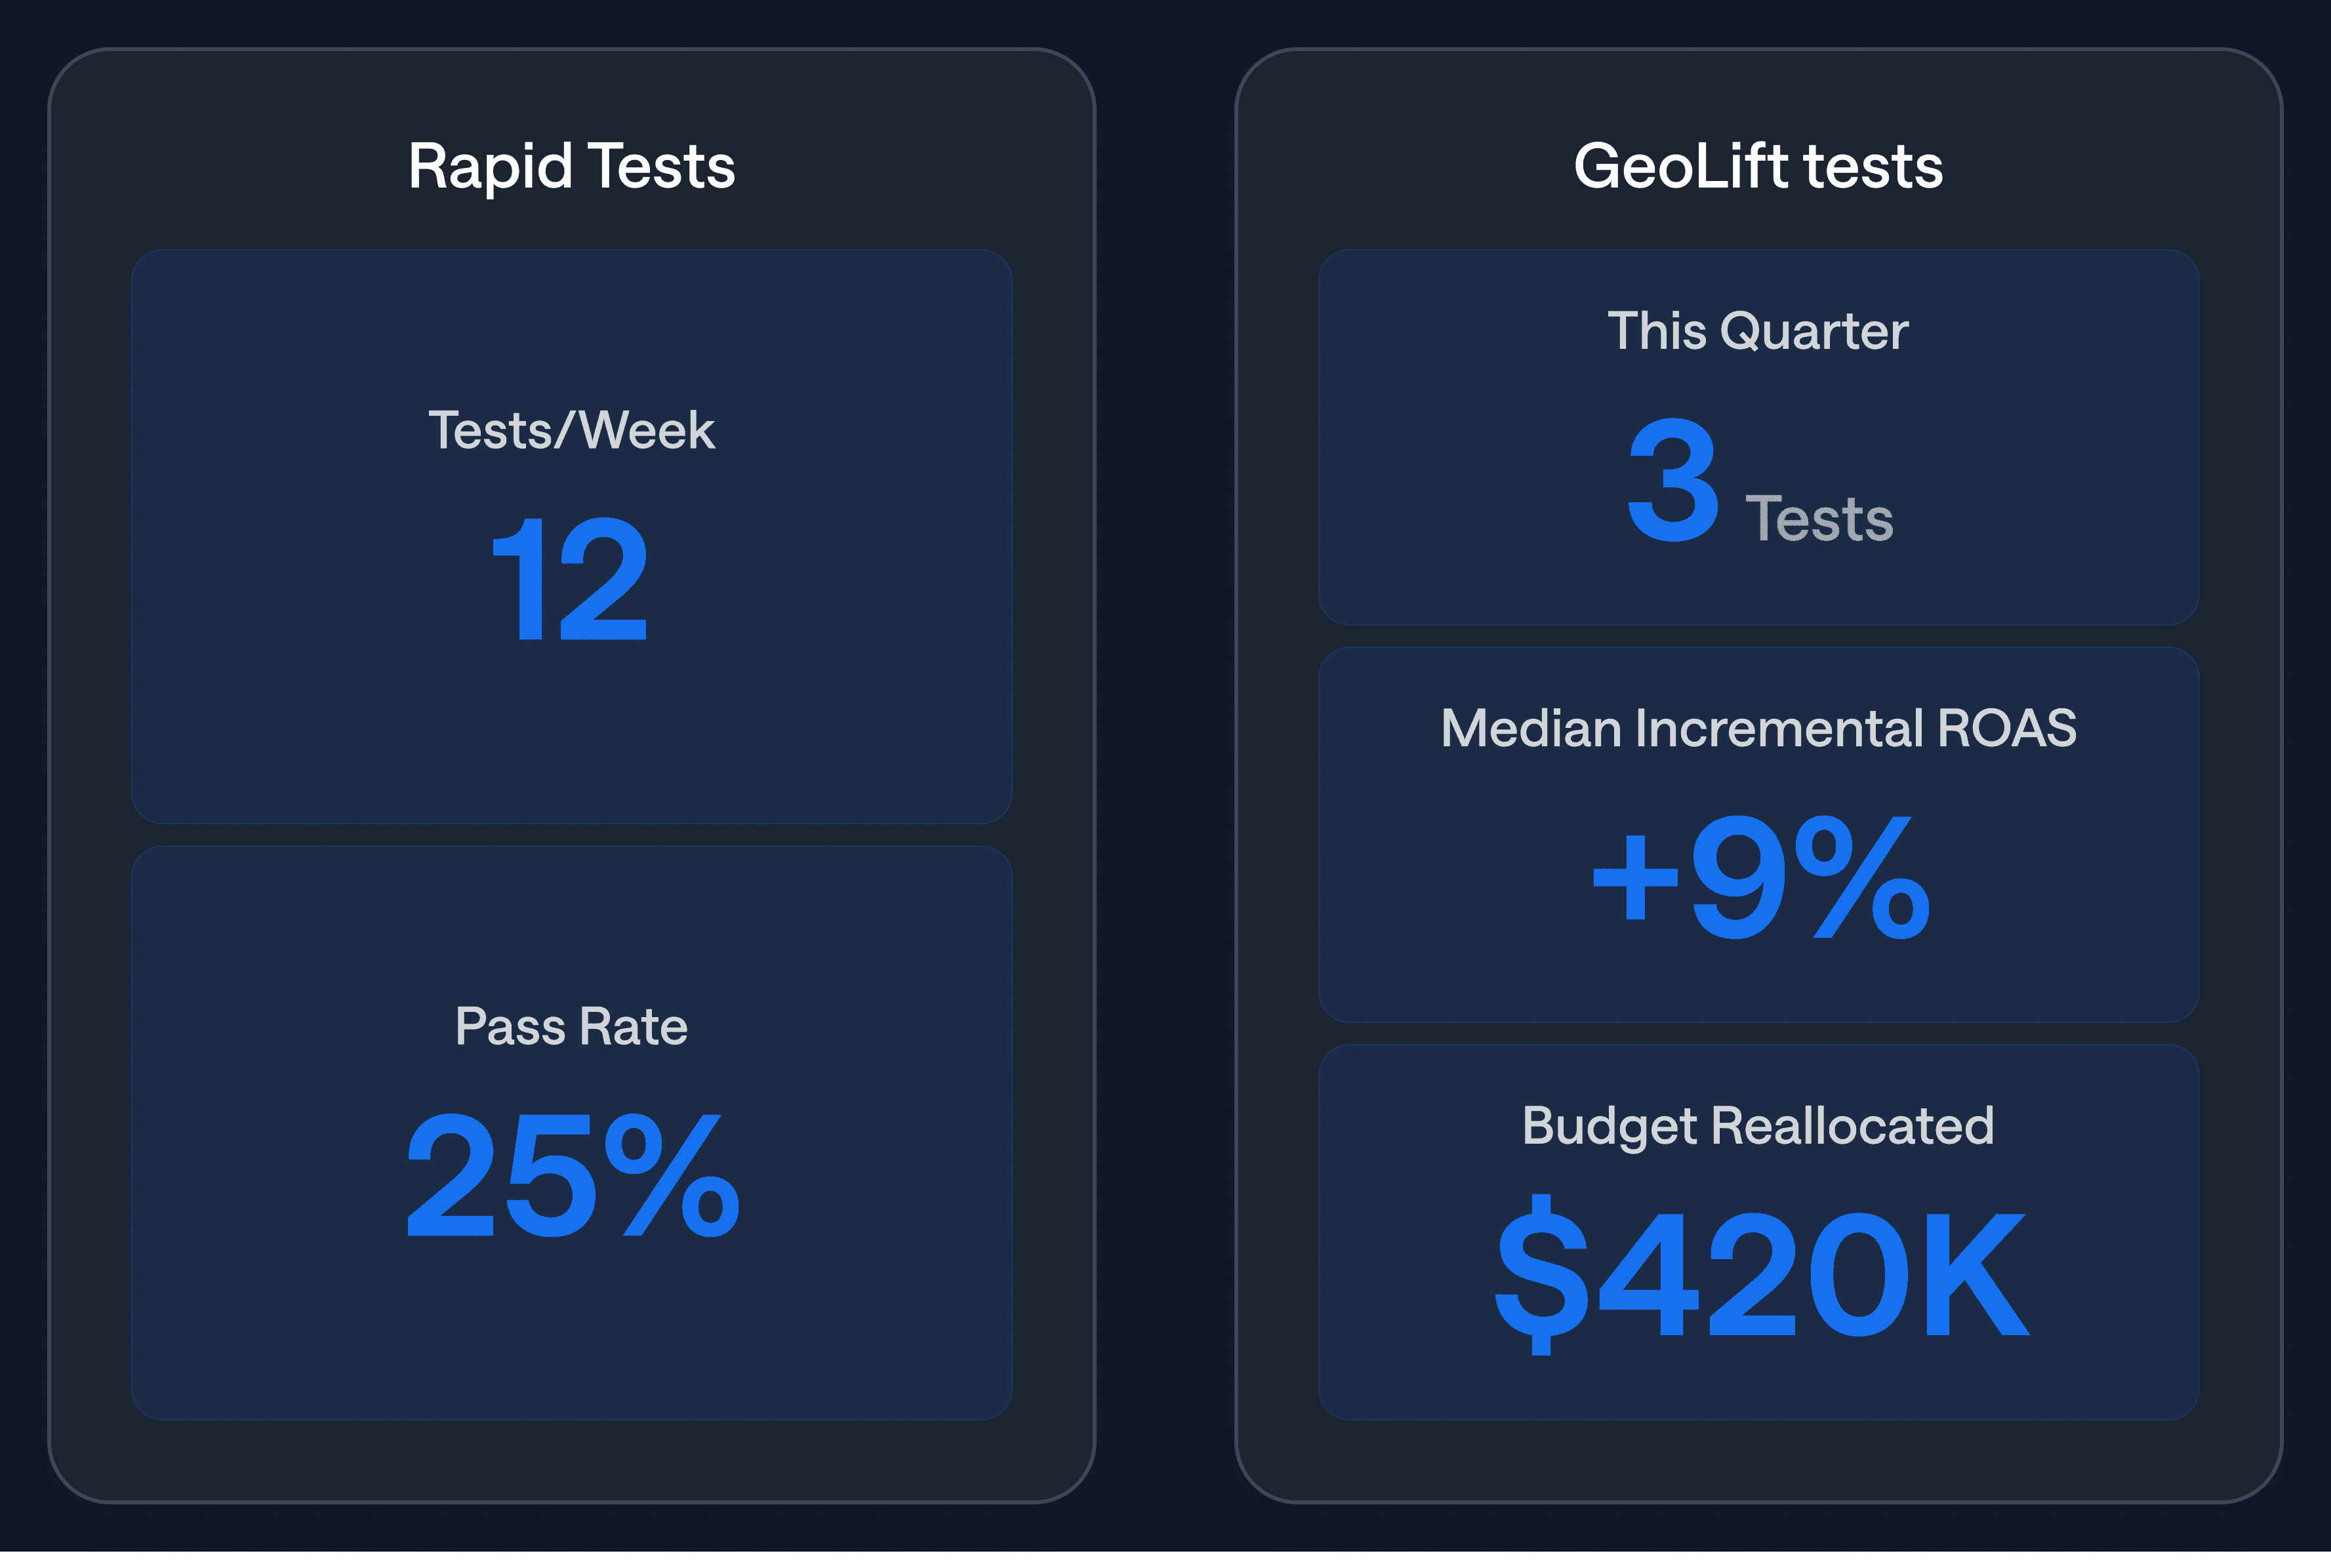
Best practice: Run lots of cheap tests, but treat incrementality tests like capital projects. Two high-confidence GeoLift studies per month drive more margin than twenty guess-and-check budget tweaks.
Benchmarks & dashboards - Your dashboard template should show separate panels: Rapid tests on the left, GeoLift tests on the right, so executives see both the volume of learning and the big dollar shifts.
Phase 4 - Spend orchestration
Pain point addressed
Attribution & channel cannibalization
Goal
Move dollars to highest marginal lift.
Inputs
Unified channel-cost (or campaign-cost) table, BlueAlpha Bayesian MMM with time-varying betas.
RACI
R Media buyer; A VP Growth / CMO; C Finance lead; I CEO.
Steps
BlueAlpha MMM runs weekly, fitting last 1-2 years of data; coefficients auto-update.
GeoLift test outputs weight recent betas higher than old ones, preventing cannibalization bias.
BlueAlpha recommends budget reallocation when incremental ROAS delta >15%.
Freeze budgets if CAC pay-back rises above 8 months.
Checklist
Attribution error <10% vs. hold-out
Spend shift executed by 9AM each Monday
Outputs → Spend rebalancing log, incrementality dashboard.
KPIs → CAC pay-back, marginal ROAS.
Phase 5 - Review & control
Pain point addressed
Resource squeeze
Goal
Institutionalize what worked, sunset what did not.
Inputs
All test logs, KPI dashboards, finance actuals.
RACI
R Ops analyst; A VP Growth; C Board observers; I Growth PM.
Steps
Auto-generate Growth Audit from BlueAlpha dashboard: North Star Metric trend, KPI ladder, cash burn.
Map tests to financial impact → cumulative incremental ARR by channel/campaign.
Set next-quarter OKRs; archive orphan road-map items.

Checklist
Audit delivered 5 days before board
Less than 15 slides
Outputs → QBR deck, updated OKRs.
KPIs → Audit completion on time, board satisfaction score.
Dashboard design
Top row → NRR, 90-day retention, CAC pay-back.
Second row → Test velocity, win rate.
Third row → Cash runway, burn multiple.
Troubleshooting If-Then Paths
If this happens | Do this |
|---|---|
Incremental ROAS negative after GeoLift | Pause channel; rerun creative test; cross-check cannibalization in MMM |
CAC pay-back > 10 months in Phase 4 | Re-run channel incrementality test. Cut bottom quartile creatives. Cut spend on channels with <1.5 incremental ROAS |
Test win rate <15% in Phase 3 | Review hypothesis quality; enforce pre-registration; raise minimum detectable effect. |
NRR <100% at Phase 5 review | Trigger expansion nudges tied to power-user milegrays. |
Benchmark Cheat Sheet
What good looks like for 90-day retention in consumer AI SaaS

Cohort benchmark | 30-day retention | 60-day retention | 90-day retention | Source |
|---|---|---|---|---|
25th-percentile SaaS (all verticals) | 46% | 36% | 25% | |
Median consumer SaaS | 59% | 46% | 30% | Pendo 2025 panel |
BlueAlpha client median | 70% | 55% | 42% | BlueAlpha anonymized data |
90th-percentile SaaS | 80% | 66% | 57% | Pendo 2025 panel |
Best-in-class AI subscription (ChatGPT Plus paid tier) | 94% | 91% | 89% |
Executive Roundtable Insights
What finally fixed attribution, retention, or both, according to peers who have already cracked the code
“Linking our CDP to acquisition sources let us see which ads drove the people who actually open newsletters and stick. We now run different nurture paths depending on where a user came from. Newsletter cadence tests are our fastest churn lever.” — Tony Varghese, Senior Marketing Manager, Lifecycle and Product @ beehiiv
In the following deep-dive conversation, EJ White (former Head of Growth at beehiiv) shares how they allocate marketing budgets between brand awareness and direct response channels to achieve their 3x+ LTV:CAC target.
Closing
Your team stands at the helm of a market growing 48% year-on-year but already crowded with hundreds of publicly tracked consumer AI apps. Apply this playbook, and you switch from gut-feel campaigns to defensible, data-compounding loops.
Predictable growth demands that every dollar you deploy is incremental, not cannibalized. Armed with reliable incrementality proof and real-time cost visibility, you can scale tests and campaigns without fear of wasting a cent.
That is how you beat rivals, earn the finance chief’s respect, and cement your place as the hero of your company’s AI story.
Let’s get shipping.
PLAYBOOK
Get this case study as a PDF
Why This Playbook Exists
This guide is for Directors and VPs of Marketing / Growth building consumer-facing AI SaaS.
Funding is tightening, model launches arrive monthly, and a single bad attribution call can vaporize half this quarter’s budget. Boards still ask for market-share stories, yet the numbers that justify spend live in five ad dashboards, three product tools, and a spreadsheet no one trusts.
This playbook equips you to turn that mess into a repeatable growth engine. You will learn how to:
Translate marketing signals into finance-ready language so the investors and the CFO can green-light bigger bets.
Diagnose and fix attribution and channel cannibalization with MMMs and incrementality tests, ending the guesswork about which half of the ad budget is wasted.
Run 10+ experiments each week without drowning in data sprawl, then scale only the touches that are provably incremental.
It draws on real benchmarks, live examples, and BlueAlpha’s first-principles measurement framework, letting you spend with confidence today and compound gains through 2027.
The “Why Now” Moment
Funding is melting into a few giants. Q1 2025 broke records with $66.6 billion flowing into AI, yet 79% of that capital sat in mega-rounds at infra vendors, leaving consumer apps to scrap for the rest.
New entrants flood the shelves. Seventeen fresh web products cracked a16z’s Top 100 Gen-AI list in just six months.
User expectations leap each model cycle. ChatGPT doubled from 200M to 400M weekly actives in under six months after GPT-4o voice rolled out .
Marketing waste is compounding. Median CAC pay-back stretched past two years for average SaaS brands in 2024 (source: Bantrr).
Fail to operationalize incrementality-based growth loops now and you risk a price-warred, churn-heavy future.
Situation Analysis
Market overview
Revenue pool: Global consumer AI software will top $32 billion ARR by EoY 2026 (Menlo Ventures forecast, June 2025).
Growth: 48% CAGR 2023-2025 for consumer AI apps tracked by Similarweb in a16z Top 100.
Funding: Early-stage deal count down 30% YoY, but ticket sizes steady (median $3.8M early-stage; source: CB Insights).
Competitor heatmap (snapshot 2026)
Segment | Usage leader | Revenue leader | Moat indicator |
|---|---|---|---|
General chat | ChatGPT (400M WAU) | ChatGPT Plus | Model depth + distribution |
Multilingual chat | DeepSeek (#2 mobile MAU) | Gemini | Local language support |
Video gen / edit | VivaCut (MAU) vs. Splice (revenue) | Splice | Prosumer tooling |
Coding IDE | Cursor (hundreds of k devs) | Cursor | Enterprise data integration |
SWOT (your org)
Strengths → proprietary engagement graph; in-house model fine-tuning.
Weaknesses → single-point attribution, lacking self-serve upgrade motions.
Opportunities → niche AI agents for hobbyist creators (CB Insights sees vertical agents maturing) .
Threats → big-tech bundles eroding willingness to pay; GPU cost volatility.
Customer insights (2026 pulse check)
Who pays? Millennials (29-44) now out-consume Gen Z in daily AI usage (source: Menlo Ventures survey).
Jobs-to-be-done: accelerate learning (33%), simplify creation (30%), save time on life admin (21%); source: Attest.
Willingness to pay: 41% of frequent users say they would pay ≥$15 per month for an AI tool that saves 3 hours per week (Attest panel, Mar 2025).
Pain spikes: Onboarding cognitive load, privacy fears, inconsistent voice outputs.
Growth Leader Scorecard
Objectives, Victory Conditions & Metrics
Success Definition
You need clear finish lines so the CFO signs the cheques and the team sees progress.
Below are entry and exit criteria for each phase. A phase is only ‘done’ when it removes a pain point and advances a strategic objective. Entry and exit gates are hard numbers, not vibes. The numbers reflect 2025 consumer AI SaaS benchmarks.
Phase | Pain point resolved | Objective served | Entry gate; Exit gate | Leading metrics |
|---|---|---|---|---|
1. Discovery | Churn hidden in growth | Sticky engagement | Churn trend unknown; Top 3 churn drivers isolated | Churn driver R² > 0.7 |
2. Segmentation | Personalization debt | Sticky engagement | No personas with LTV data; JTBD + LTV personas live | LTV spread ≥ 4× |
3. Experimentation | Data sprawl & slow tests | Predictable growth | < 3 valid tests/wk; | |
0 incrementality tests/month | ≥ 10 total tests/wk (product + UX + creative) | |||
1-2 incrementality tests/month | Test velocity (all tests), GeoLift cadence, lift per incrementality test, action adoption rate | |||
4. Scale orchestration | Attribution & cannibalization | Efficient cross-channel spend | CAC pay-back >10 months; <8 months (consumer median is 4-7; source: First Page Sage) | Incremental ROAS, CAC pay-back |
5. Review & control | Resource squeeze | Healthy unit economics | No audit cycle; Quarterly Growth Audit sent | Audit on time, board NPS |
North-star metric → Net Revenue Retention (NRR); when NRR rises, you are compounding.
Supporting metrics → CAC pay-back, 90-day retention, burn multiple.
Key experimentation metrics → All-test velocity, incrementality cadence, cumulative ARR from “needle-mover” tests.
Benchmark cheat sheet
Category | Metric | Median | Top quartile |
|---|---|---|---|
Growth | CAC pay-back (consumer SaaS) | 6 months (First Page Sage) | 3 months |
Engagement | 90-day retention | 30% (Pendo.io) | 45%+ |
Efficiency | CLTV : CAC | 3.0 (Benchmarkit) | 5.0+ |
Expansion | NRR | 104% (SaaS Capital) | 118% |
Finance Lens
Pricing moves to outcome units, not seats. ElevenLabs tweaked ladders seven times in 40 days; Salesforce adopted outcome-based pricing with Agentforce’s $2 per conversation and Flex Credits models.
‘ARR + annualized usage’ replaces single ARR rows.
GPU cost per active user exposes margin leaks in real time.
Databricks feeds live telemetry into an AI forecast model, not Excel sheets.
Phases at a glance
Phase | Goal | Typical time box | Primary owner | Key output |
|---|---|---|---|---|
1. Discovery | Map demand & friction | 1-2 weeks | Growth Manager | Insight memo |
2. Segmentation | Rank personas by LTV | 2 weeks | Data Lead | Persona deck |
3. Experimentation | 10+ rapid tests per week; 1-2 incrementality tests per month | Continuous | Experiment squad | Unified test log |
4. Spend orchestration | Reallocate $ to real lift | Continuous | VP Growth | Weekly spend script |
5. Review & control | Institutionalize learnings | 2 days per quarter | VP Growth / CMO | Board deck |
Deep-Dive Instructions
Phase 1 - Discovery
Pain point addressed
Churn hidden in growth
Why it matters
You cannot optimize what you cannot name. A clear demand map focuses limited tokens and GPU cycles.
Inputs
Analytics event stream, customer interviews (10 × 15 min), refund tags.
RACI
R Data analyst; A Growth Manager; C Support lead; I VP Eng.
Steps
Export last 60 days events; run Pareto on time-to-value.
Conduct five in-app polls to capture intent; tag JTBD.
Cluster qualitative answers using thematic AI (e.g., GPT-4o) to surface JTBD; isolate top 5 churn drivers.
Present findings in 15-slide memo.
Quality checklist
At least 200 survey responses
Clusters explain 80% of churn reasons
Outputs → Insight memo, updated taxonomy.
KPIs → Survey completion, activation time delta.
Phase 2 - Segmentation
Pain point addressed
Personalization debt
Goal
Turn raw insights into monetizable personas.
Inputs
Event taxonomy, JTBD clusters, spend cohorts.
RACI
R Data science; A VP Growth; C Product design; I Support.
Broad steps
Use BlueAlpha to build a RFM (recency-frequency-monetary) table.
Layer JTBD tags.
Compute LTV distribution; flag top decile.
Draft persona pages; align each persona with messaging & value prop.
Checklist
Segments mutually exclusive & collectively exhaustive
LTV spread >4× between top and bottom quartile.
Typical duration → 2 weeks.
Outputs → Persona one-pagers.
KPIs → LTV spread, segment coverage.
Phase 3 - Experimentation
Pain point addressed
Data sprawl & slow tests
RACI
R Experiment owner; A Head of Growth; C Data science; I Legal (for privacy).
3A. Rapid-cycle tests
Goal → Find small wins fast: pricing copy, UX tweaks, creative angles.
Cadence → ≥ 10 per week.
Tooling → In-app A/B platform, feature flags.
Steps
Pull backlog ideas into a Kanban board every Monday.
Pre-register goal + MDE; design runs 1–3 days.
Deploy to 100 % when lift > 2 % and p < 0.05.
Log result in BlueAlpha test ledger.
3B. Incrementality tests (GeoLift / MMM refresh)
Goal → Answer strategic spend questions (e.g. “What is YouTube really worth after cannibalization?”)
Cadence → 1-2 tests per month (2-3 weeks runtime for each test).
Tooling → BlueAlpha GeoLift wizard + BlueAlpha Bayesian MMM.
Steps
Frame a question tied to budget action (e.g. shift 20% from Meta to TikTok).
BlueAlpha selects for you geo clusters large enough for 80% power.
Freeze other media variables in test regions to reduce confounds.
Run test 21 days; BlueAlpha updates MMM priors with lift estimate.
If incremental ROAS delta > +15%, move spend; if negative, pause.
Close the loop: document action and measured impact.
Quality checklist
No overlapping incrementality tests in adjacent DMAs.
Post-test decision written before the test starts.
Lift fed back into MMM the same day results lock.
Best practice: Run lots of cheap tests, but treat incrementality tests like capital projects. Two high-confidence GeoLift studies per month drive more margin than twenty guess-and-check budget tweaks.
Benchmarks & dashboards - Your dashboard template should show separate panels: Rapid tests on the left, GeoLift tests on the right, so executives see both the volume of learning and the big dollar shifts.
Phase 4 - Spend orchestration
Pain point addressed
Attribution & channel cannibalization
Goal
Move dollars to highest marginal lift.
Inputs
Unified channel-cost (or campaign-cost) table, BlueAlpha Bayesian MMM with time-varying betas.
RACI
R Media buyer; A VP Growth / CMO; C Finance lead; I CEO.
Steps
BlueAlpha MMM runs weekly, fitting last 1-2 years of data; coefficients auto-update.
GeoLift test outputs weight recent betas higher than old ones, preventing cannibalization bias.
BlueAlpha recommends budget reallocation when incremental ROAS delta >15%.
Freeze budgets if CAC pay-back rises above 8 months.
Checklist
Attribution error <10% vs. hold-out
Spend shift executed by 9AM each Monday
Outputs → Spend rebalancing log, incrementality dashboard.
KPIs → CAC pay-back, marginal ROAS.
Phase 5 - Review & control
Pain point addressed
Resource squeeze
Goal
Institutionalize what worked, sunset what did not.
Inputs
All test logs, KPI dashboards, finance actuals.
RACI
R Ops analyst; A VP Growth; C Board observers; I Growth PM.
Steps
Auto-generate Growth Audit from BlueAlpha dashboard: North Star Metric trend, KPI ladder, cash burn.
Map tests to financial impact → cumulative incremental ARR by channel/campaign.
Set next-quarter OKRs; archive orphan road-map items.
Checklist
Audit delivered 5 days before board
Less than 15 slides
Outputs → QBR deck, updated OKRs.
KPIs → Audit completion on time, board satisfaction score.
Dashboard design
Top row → NRR, 90-day retention, CAC pay-back.
Second row → Test velocity, win rate.
Third row → Cash runway, burn multiple.
Troubleshooting If-Then Paths
If this happens | Do this |
|---|---|
Incremental ROAS negative after GeoLift | Pause channel; rerun creative test; cross-check cannibalization in MMM |
CAC pay-back > 10 months in Phase 4 | Re-run channel incrementality test. Cut bottom quartile creatives. Cut spend on channels with <1.5 incremental ROAS |
Test win rate <15% in Phase 3 | Review hypothesis quality; enforce pre-registration; raise minimum detectable effect. |
NRR <100% at Phase 5 review | Trigger expansion nudges tied to power-user milegrays. |
Benchmark Cheat Sheet
What good looks like for 90-day retention in consumer AI SaaS
Cohort benchmark | 30-day retention | 60-day retention | 90-day retention | Source |
|---|---|---|---|---|
25th-percentile SaaS (all verticals) | 46% | 36% | 25% | |
Median consumer SaaS | 59% | 46% | 30% | Pendo 2025 panel |
BlueAlpha client median | 70% | 55% | 42% | BlueAlpha anonymized data |
90th-percentile SaaS | 80% | 66% | 57% | Pendo 2025 panel |
Best-in-class AI subscription (ChatGPT Plus paid tier) | 94% | 91% | 89% |
Executive Roundtable Insights
What finally fixed attribution, retention, or both, according to peers who have already cracked the code
“Linking our CDP to acquisition sources let us see which ads drove the people who actually open newsletters and stick. We now run different nurture paths depending on where a user came from. Newsletter cadence tests are our fastest churn lever.” — Tony Varghese, Senior Marketing Manager, Lifecycle and Product @ beehiiv
In the following deep-dive conversation, EJ White (former Head of Growth at beehiiv) shares how they allocate marketing budgets between brand awareness and direct response channels to achieve their 3x+ LTV:CAC target.
Closing
Your team stands at the helm of a market growing 48% year-on-year but already crowded with hundreds of publicly tracked consumer AI apps. Apply this playbook, and you switch from gut-feel campaigns to defensible, data-compounding loops.
Predictable growth demands that every dollar you deploy is incremental, not cannibalized. Armed with reliable incrementality proof and real-time cost visibility, you can scale tests and campaigns without fear of wasting a cent.
That is how you beat rivals, earn the finance chief’s respect, and cement your place as the hero of your company’s AI story.
Let’s get shipping.
PLAYBOOK
Get this case study as a PDF
