How to Break Free from Single-Channel Dependency with MMM & Incrementality Testing
Reduce channel concentration risk and build a resilient marketing mix through data-driven diversification
Budget Allocation
Incrementality Testing

Why This Playbook Exists
Problem: When 70%+ of your customer acquisition comes from a single advertising channel, you're one algorithm change, policy update, or platform outage away from catastrophic revenue loss.
Solution: Use Marketing Mix Modeling (MMM) combined with systematic incrementality testing to identify, validate, and scale diversification opportunities without sacrificing efficiency.
Outcome: Reduce channel concentration risk from 0.78 to <0.40 (Gini coefficient) while maintaining or improving overall CAC.
For: Growth teams, marketing leaders, and data teams at companies with $100K+ monthly ad spend concentrated in 1-2 channels.
When to Use This Playbook
Use Case | Signals It Fits |
|---|---|
Over-reliance on Google/Meta | 70%+ of conversions from single channel |
Platform risk concerns | Recent algorithm changes impacting performance |
Board mandate for diversification | "What's our backup plan?" questions arising |
Plateau in primary channel | Diminishing returns despite budget increases |
Compliance/regulatory pressure | Industry-specific advertising restrictions emerging |
Prerequisites
Minimum 3-6 months of historical spend and conversion data
Ability to track conversions across multiple channels
Budget flexibility to test new channels (10-20% of total)
MMM capability or vendor (internal or external)
Executive buy-in for temporary efficiency trade-offs
Step-by-Step Framework
Phase 1: Diagnose Your Concentration Risk (Week 1-2)
Goal: Quantify your vulnerability and establish baseline metrics.
Actions:
Calculate channel concentration using Gini coefficient
Pull last 6 months of spend by channel
Calculate cumulative spend percentages
Plot Lorenz curve and derive Gini score
Benchmark: >0.6 = high risk, 0.4-0.6 = moderate, <0.4 = healthy
Map your current channel mix
Document spend, conversions, and CPA by channel
Identify top 3 channels by volume
Calculate percentage of total conversions per channel

This visualization shows the correlation between different marketing channels and your primary KPI over time, helping identify which channels move together and which provide true diversification.
Assess platform-specific risks
Review recent policy changes
Analyze historical volatility (CPM/CPC trends)
Document any account warnings or issues

A “Gini Coefficient chart” displays concentration risk over time, with clear zones for high risk (>0.6) and moderate risk (0.4-0.6), helping stakeholders immediately understand the urgency of diversification.
Phase 2: Build Your Measurement Foundation (Week 2-4)
Goal: Deploy MMM to understand true channel contribution beyond last-click attribution.
Actions:
Set up Marketing Mix Model
Define primary KPI (first-time conversions recommended)
Aggregate weekly spend data by channel
Include external factors (seasonality, promotions)
Run initial model with 6+ months of data
Identify incrementality testing opportunities
Rank channels by MMM-attributed contribution
Flag channels showing high last-click but low MMM attribution
Prioritize 3-5 channels for testing
Design test roadmap
Map out 4-6 week testing windows
Calculate minimum detectable effects (aim for 10-15% lift detection)
Allocate 10-20% of budget for testing
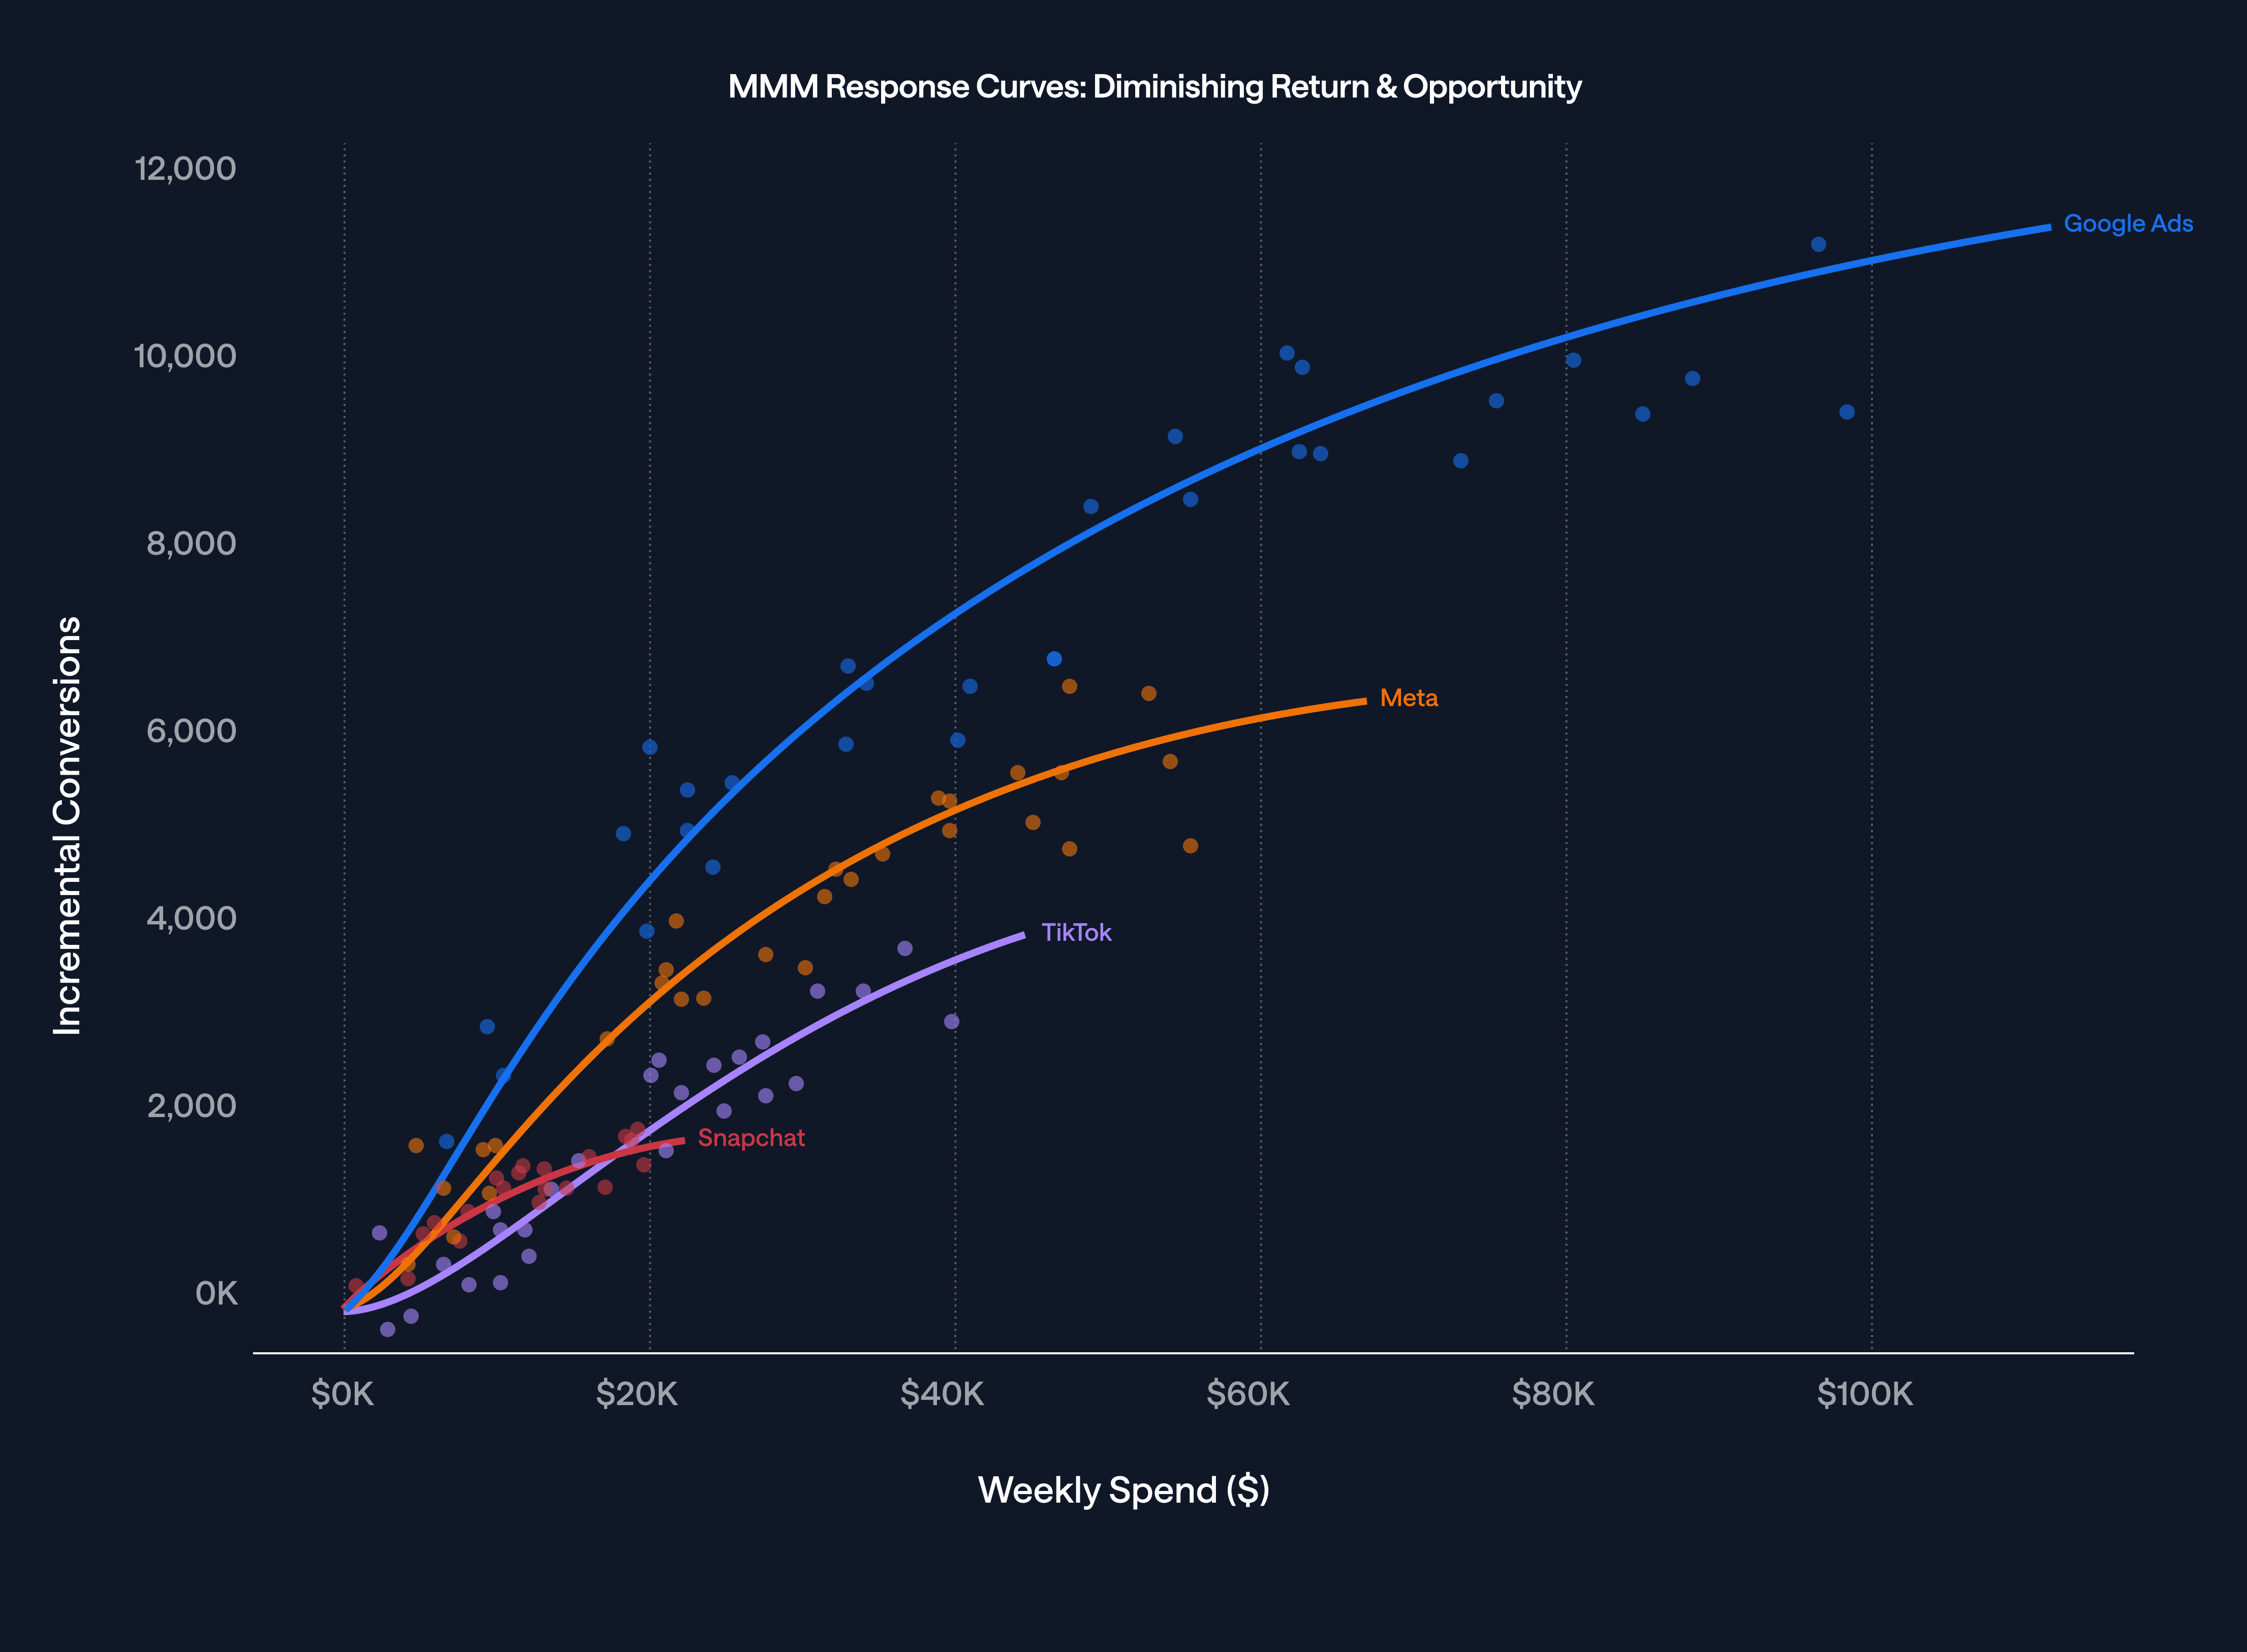
MMM response curves showing diminishing returns on primary channel and opportunity areas in emerging channels.
Phase 3: Systematic Testing & Validation (Week 4-12)
Goal: Validate diversification opportunities through controlled experiments.
Actions:
Run geo-based incrementality tests

Execute channel-specific tests
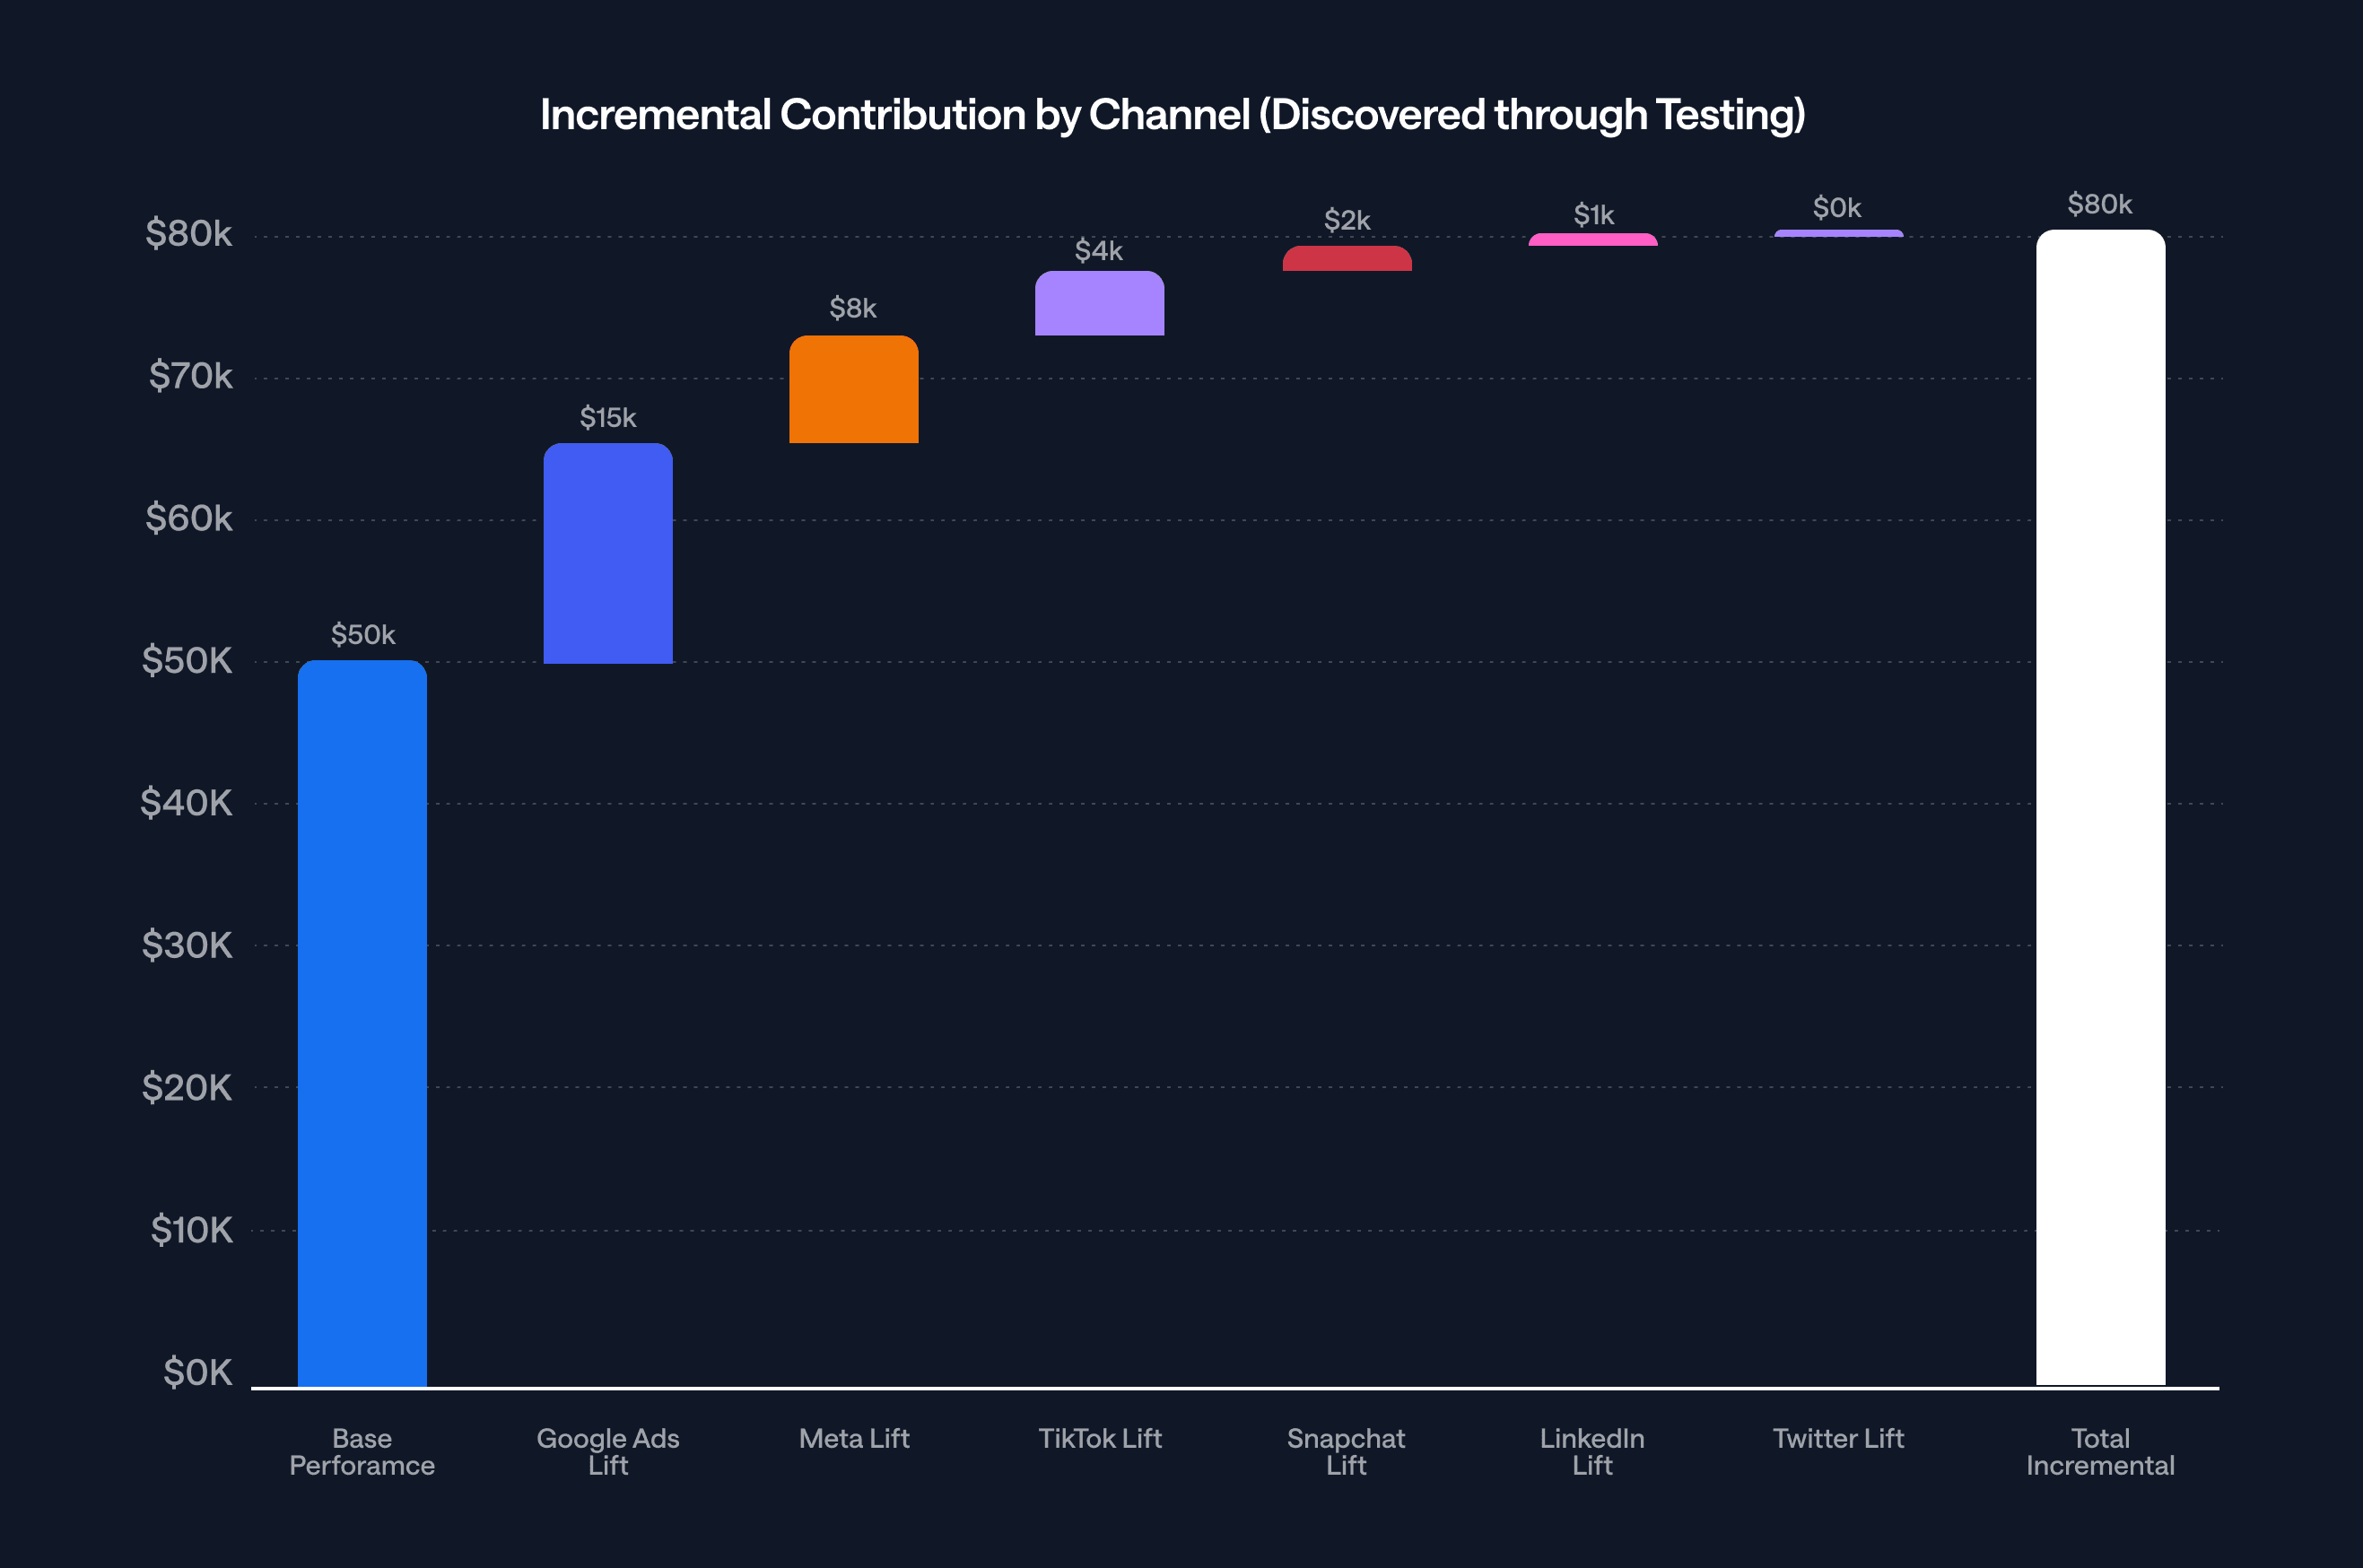
Real-world example progression (Klover case study):
Week 1-4: TikTok geo-lift (discovered 48% incrementality)
Week 5-8: Meta reduction test (found plateau at $60K/week)
Week 9-12: Apple Search scale test (validated efficiency at higher spend)
Document learnings systematically
Record actual vs. predicted lift
Calculate incremental CPA by funnel stage
Phase 4: Scale & Optimize (Week 12+)
Goal: Reallocate budget based on validated incrementality while monitoring concentration metrics.
Actions:
Implement phased reallocation

Optimize new channels for efficiency
Test creative formats native to each platform
Adjust bidding strategies based on platform algorithms
Implement platform-specific conversion tracking
Establish channel portfolio targets
Primary channel: Max 50% of spend
Secondary channels: 20-30% each
Testing budget: Always maintain 10%
Gini coefficient target: <0.45

A portfolio allocation chart will show your recommended channel mix based on risk tolerance and efficiency goals.
Metrics & Monitoring Dashboard
Primary Metrics
Gini Coefficient: Track weekly, alert if >0.6
Incremental CPA by Channel: Compare to blended goal
Channel Revenue Contribution: MMM-attributed vs last-click
Secondary Metrics
Platform health scores (account warnings, policy violations)
Creative fatigue indicators by channel
Audience overlap percentage between channels
Reporting Cadence
Weekly: Channel performance and concentration metrics
Monthly: MMM refresh and incrementality test results
Quarterly: Strategic channel portfolio review

Common Pitfalls to Avoid
❌ Testing too many channels simultaneously
Dilutes budget below statistical significance thresholds
Solution: Prioritize 2-3 channels maximum per quarter
❌ Ignoring platform-native best practices
Copying Google Ads strategies to TikTok/Meta
Solution: Invest in platform-specific creative and targeting
❌ Pulling back too quickly on underperforming tests
Platform learning phases require 2-3 weeks minimum
Solution: Commit to full test duration before decisions
❌ Over-correcting based on single test results
One test doesn't account for seasonality/external factors
Solution: Validate with follow-up tests or longer duration
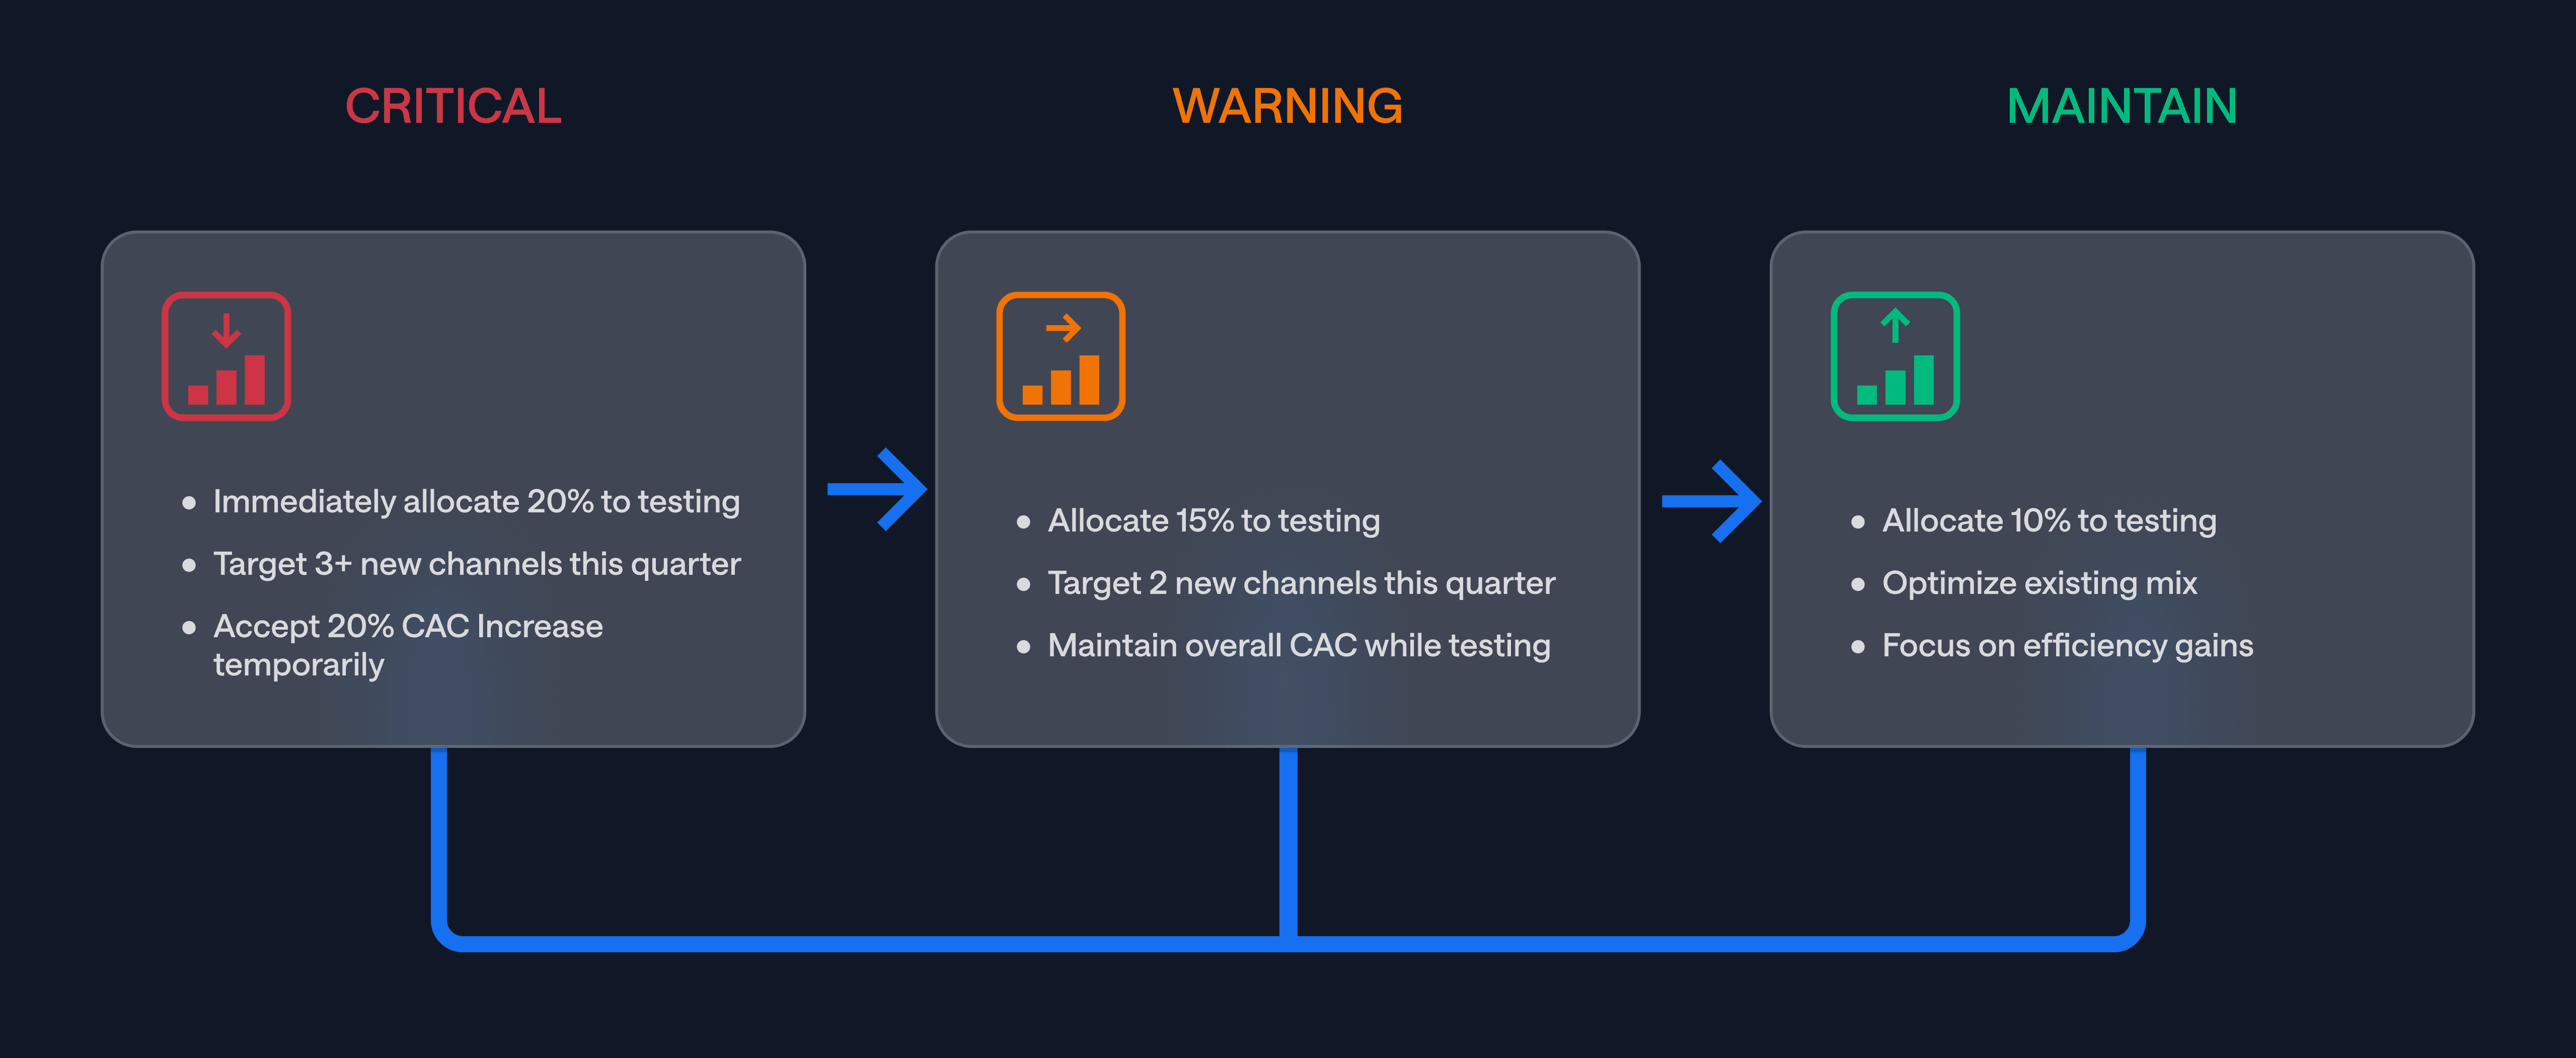
Decision Framework
Resources & Templates
Benchmark Data
Healthy channel mix by vertical:
SaaS: No channel >40%, 4+ active channels
E-commerce: No channel >50%, 3+ active channels
Mobile apps: No channel >45%, 5+ active channels
Success Story Snapshot
Klover’s growth team reduced their Google Ads dependency from 74% to 45% over 16 weeks using this framework. Despite initial concerns about efficiency loss, their blended CAC actually improved by 12% as they discovered undervalued channels through systematic testing. Their Gini coefficient dropped from 0.78 to 0.42, significantly reducing platform risk.
Next Steps Checklist
Week 1
☐ Calculate current Gini coefficient
☐ Document channel concentration percentages
☐ Identify top 3 diversification candidates
Week 2
☐ Set up MMM or engage vendor
☐ Design first incrementality test
☐ Secure budget approval for testing
Week 4
☐ Launch first geo-based test
☐ Establish monitoring dashboard
☐ Schedule weekly review cadence
Week 8
☐ Analyze test results
☐ Design follow-up validation tests
☐ Present initial findings to stakeholders
Week 12
☐ Implement budget reallocation
☐ Document playbook customizations
☐ Set quarterly review schedule
PLAYBOOK
Get this case study as a PDF
Why This Playbook Exists
Problem: When 70%+ of your customer acquisition comes from a single advertising channel, you're one algorithm change, policy update, or platform outage away from catastrophic revenue loss.
Solution: Use Marketing Mix Modeling (MMM) combined with systematic incrementality testing to identify, validate, and scale diversification opportunities without sacrificing efficiency.
Outcome: Reduce channel concentration risk from 0.78 to <0.40 (Gini coefficient) while maintaining or improving overall CAC.
For: Growth teams, marketing leaders, and data teams at companies with $100K+ monthly ad spend concentrated in 1-2 channels.
When to Use This Playbook
Use Case | Signals It Fits |
|---|---|
Over-reliance on Google/Meta | 70%+ of conversions from single channel |
Platform risk concerns | Recent algorithm changes impacting performance |
Board mandate for diversification | "What's our backup plan?" questions arising |
Plateau in primary channel | Diminishing returns despite budget increases |
Compliance/regulatory pressure | Industry-specific advertising restrictions emerging |
Prerequisites
Minimum 3-6 months of historical spend and conversion data
Ability to track conversions across multiple channels
Budget flexibility to test new channels (10-20% of total)
MMM capability or vendor (internal or external)
Executive buy-in for temporary efficiency trade-offs
Step-by-Step Framework
Phase 1: Diagnose Your Concentration Risk (Week 1-2)
Goal: Quantify your vulnerability and establish baseline metrics.
Actions:
Calculate channel concentration using Gini coefficient
Pull last 6 months of spend by channel
Calculate cumulative spend percentages
Plot Lorenz curve and derive Gini score
Benchmark: >0.6 = high risk, 0.4-0.6 = moderate, <0.4 = healthy
Map your current channel mix
Document spend, conversions, and CPA by channel
Identify top 3 channels by volume
Calculate percentage of total conversions per channel
This visualization shows the correlation between different marketing channels and your primary KPI over time, helping identify which channels move together and which provide true diversification.
Assess platform-specific risks
Review recent policy changes
Analyze historical volatility (CPM/CPC trends)
Document any account warnings or issues
A “Gini Coefficient chart” displays concentration risk over time, with clear zones for high risk (>0.6) and moderate risk (0.4-0.6), helping stakeholders immediately understand the urgency of diversification.
Phase 2: Build Your Measurement Foundation (Week 2-4)
Goal: Deploy MMM to understand true channel contribution beyond last-click attribution.
Actions:
Set up Marketing Mix Model
Define primary KPI (first-time conversions recommended)
Aggregate weekly spend data by channel
Include external factors (seasonality, promotions)
Run initial model with 6+ months of data
Identify incrementality testing opportunities
Rank channels by MMM-attributed contribution
Flag channels showing high last-click but low MMM attribution
Prioritize 3-5 channels for testing
Design test roadmap
Map out 4-6 week testing windows
Calculate minimum detectable effects (aim for 10-15% lift detection)
Allocate 10-20% of budget for testing
MMM response curves showing diminishing returns on primary channel and opportunity areas in emerging channels.
Phase 3: Systematic Testing & Validation (Week 4-12)
Goal: Validate diversification opportunities through controlled experiments.
Actions:
Run geo-based incrementality tests
Execute channel-specific tests
Real-world example progression (Klover case study):
Week 1-4: TikTok geo-lift (discovered 48% incrementality)
Week 5-8: Meta reduction test (found plateau at $60K/week)
Week 9-12: Apple Search scale test (validated efficiency at higher spend)
Document learnings systematically
Record actual vs. predicted lift
Calculate incremental CPA by funnel stage
Phase 4: Scale & Optimize (Week 12+)
Goal: Reallocate budget based on validated incrementality while monitoring concentration metrics.
Actions:
Implement phased reallocation
Optimize new channels for efficiency
Test creative formats native to each platform
Adjust bidding strategies based on platform algorithms
Implement platform-specific conversion tracking
Establish channel portfolio targets
Primary channel: Max 50% of spend
Secondary channels: 20-30% each
Testing budget: Always maintain 10%
Gini coefficient target: <0.45
A portfolio allocation chart will show your recommended channel mix based on risk tolerance and efficiency goals.
Metrics & Monitoring Dashboard
Primary Metrics
Gini Coefficient: Track weekly, alert if >0.6
Incremental CPA by Channel: Compare to blended goal
Channel Revenue Contribution: MMM-attributed vs last-click
Secondary Metrics
Platform health scores (account warnings, policy violations)
Creative fatigue indicators by channel
Audience overlap percentage between channels
Reporting Cadence
Weekly: Channel performance and concentration metrics
Monthly: MMM refresh and incrementality test results
Quarterly: Strategic channel portfolio review
Common Pitfalls to Avoid
❌ Testing too many channels simultaneously
Dilutes budget below statistical significance thresholds
Solution: Prioritize 2-3 channels maximum per quarter
❌ Ignoring platform-native best practices
Copying Google Ads strategies to TikTok/Meta
Solution: Invest in platform-specific creative and targeting
❌ Pulling back too quickly on underperforming tests
Platform learning phases require 2-3 weeks minimum
Solution: Commit to full test duration before decisions
❌ Over-correcting based on single test results
One test doesn't account for seasonality/external factors
Solution: Validate with follow-up tests or longer duration
Decision Framework
Resources & Templates
Benchmark Data
Healthy channel mix by vertical:
SaaS: No channel >40%, 4+ active channels
E-commerce: No channel >50%, 3+ active channels
Mobile apps: No channel >45%, 5+ active channels
Success Story Snapshot
Klover’s growth team reduced their Google Ads dependency from 74% to 45% over 16 weeks using this framework. Despite initial concerns about efficiency loss, their blended CAC actually improved by 12% as they discovered undervalued channels through systematic testing. Their Gini coefficient dropped from 0.78 to 0.42, significantly reducing platform risk.
Next Steps Checklist
Week 1
☐ Calculate current Gini coefficient
☐ Document channel concentration percentages
☐ Identify top 3 diversification candidates
Week 2
☐ Set up MMM or engage vendor
☐ Design first incrementality test
☐ Secure budget approval for testing
Week 4
☐ Launch first geo-based test
☐ Establish monitoring dashboard
☐ Schedule weekly review cadence
Week 8
☐ Analyze test results
☐ Design follow-up validation tests
☐ Present initial findings to stakeholders
Week 12
☐ Implement budget reallocation
☐ Document playbook customizations
☐ Set quarterly review schedule
PLAYBOOK
Get this case study as a PDF
