How to Measure OOH Advertising: Geo Holdouts, MMM, and Incremental CPA
Learn how to quantify the incremental impact of OOH campaigns using geo holdout testing, marketing mix modeling, and modern audience measurement. This playbook gives you the full framework: from designing your first OOH test to calculating incremental CPA and making a scale-or-pause decision with statistical confidence.
Incrementality Testing

Why This Playbook Exists
Out-of-home advertising is one of the few remaining channels where large budgets are routinely deployed without causal measurement. Billboards, subway panels, bus shelters, and digital signage saturate the physical environment, but the question that matters most to the marketing team goes unanswered: did this spend actually drive incremental business outcomes, or are we just entertaining commuters?
The gap is not data availability. Modern OOH measurement standards from Geopath, OAAA, and the MRC now enable daily frame-level impression forecasting with near-digital precision. Mobile location signals, connected vehicles, and programmatic DOOH platforms generate usable audience data. The gap is methodology: knowing how many people walked past a billboard tells you nothing about whether those exposures caused someone to visit your site, sign up, or buy.
This playbook solves that problem. It walks you through a proven framework for measuring OOH campaigns using geo holdout experiments and marketing mix modeling (MMM), the same approach that produced the first statistically validated OOH measurement study for beehiiv's $300K NYC subway campaign, which uncovered ~100,000 incremental new users at 95% statistical confidence.
You will leave this playbook knowing how to design a geo holdout test, select the right metrics, model causal lift, calculate incremental CPA at every funnel stage, and make a data-backed decision about whether to scale, refine, or pause your offline spend.
Who This Playbook Is For
Use case | Signals it fits |
|---|---|
First offline test (OOH, transit, print, DOOH) | $20K+ media budget, clear geographic targeting options |
Board or CFO asks "show me the impact" | Need statistical confidence before scaling |
Need to compare offline to digital ROI | MMM already running for digital channels, or planning to start |
Evaluating whether to expand OOH into new markets | Need a replicable measurement framework across cities |
OOH vendor says "trust our impression data" | Want independent, causal validation beyond vendor-reported metrics |
Prerequisites
Before you begin, confirm you have the following in place:
Daily or weekly outcome data by market. Web sessions, signups, and purchases (or your equivalent funnel stages) segmented by geography. GA4 with geo-level views is the most common source.
Ability to withhold media in at least one comparable geo region. You need a control market where OOH does not run. If your campaign is already live everywhere, a retroactive geo holdout analysis is still possible if you have at least one market without OOH exposure (see Phase 2 below).
OOH spend and impression data at daily or weekly granularity. Ask your vendor for daily frame-level or site-level as-delivered data. If they can only provide flight-level totals, you can still proceed, but your model resolution will be lower.
MMM tooling that supports geo-level variables. You need the ability to add a binary "treatment x time period" variable (a geo dummy) to your marketing mix model. If you do not have MMM infrastructure, the geo holdout test alone still produces a valid incrementality read.
A primary KPI defined before the campaign starts. Do not retrofit your success metric after seeing results.
The OOH Measurement Problem: Why Impressions Alone Are Not Enough
Before jumping into the test design, it helps to understand why OOH measurement is structurally harder than digital, and why the standard OOH metrics your vendor reports are necessary but insufficient.
OOH Is Not Clickable
Digital measurement rests on a direct signal: someone clicked, converted, or abandoned. OOH generates no click. There is no pixel, no cookie, no device-level conversion event tied to a billboard exposure. That does not mean OOH is unmeasurable. It means measurement requires a different toolkit: one built around geographic experiments and statistical modeling rather than user-level tracking.
Vendor-Reported Impressions Measure Exposure, Not Impact
The OOH industry has developed a layered hierarchy of impression definitions, each progressively more precise:
Impressions (circulation). The raw count of people who pass the OOH asset. This is the baseline metric and the one most vendors report by default. It tells you potential audience size but says nothing about whether anyone noticed, remembered, or acted on the ad.
Opportunity to See (OTS). Sometimes called "viewable impressions." This filters the raw count to include only passersby for whom the ad was physically visible: not obstructed, properly illuminated, within the viewer's line of sight. This is the OOH equivalent of digital viewability standards.
Likelihood to See (LTS). The most refined tier. LTS applies probability models factoring in dwell time, viewing angle, speed of traffic, and environmental context to estimate how many people likely noticed the ad. Some vendors reference eye-tracking studies or dwell-time analytics to calibrate these probabilities.
Each step up this ladder is more precise. But even LTS, the most advanced standard impression metric, answers "how many people probably saw this?" It does not answer "did seeing this cause them to do anything they would not have done otherwise?" That is the incrementality question, and it requires a different approach.
Low-Reliability Direct Response Methods
QR codes, vanity URLs, and promo codes capture only the small fraction of people who consciously take an immediate action in response to OOH exposure. These methods systematically undercount OOH's actual contribution because the channel's primary effect is awareness and brand recall, not immediate direct response. A person who sees a subway ad on Monday and Googles your brand on Wednesday will never show up in your QR code scan data. Building an OOH measurement strategy around direct response tracking alone will consistently undervalue the channel.
The One-to-Many Problem
A single billboard is visible to thousands of passersby across multiple demographic segments, commute patterns, and levels of attention. That broad coverage is a strength for brand building, but it makes metrics like duplication (the same person seeing the same ad multiple times across different formats) and dwell time difficult to isolate at the individual level. Standardized audience measurement frameworks help, but they quantify exposure distribution, not business outcomes.
The Four Methods for Measuring OOH Performance
The right OOH measurement approach depends on what question you are trying to answer. These four methods are complementary, not competing. A comprehensive strategy uses impression data as the base layer and layers on causal methods to connect exposure to outcomes.
1. Impression and Audience Data
The foundational layer. At minimum, you track how many people were exposed to the OOH asset using the impression hierarchy described above (raw impressions, OTS, or LTS). Modern OOH platforms integrate mobile location signals and connected-vehicle data to produce audience composition breakdowns: age, income, commute patterns, and interest segments.
This data is essential for planning and vendor evaluation. It does not, on its own, tell you whether the campaign worked.
Best for: Media planning, vendor comparison, reach and frequency estimation, post-campaign reporting on exposure levels.
2. Geo Holdout Testing (Incrementality)
The core method this playbook teaches. You run your OOH campaign in one or more treatment markets while withholding media from comparable control markets. By comparing outcomes (site visits, signups, purchases) between treatment and control, you isolate the causal lift attributable to OOH.
This is the same experimental logic used in clinical trials: treatment vs. control, with statistical significance thresholds applied to the observed difference.
Best for: Answering "did this campaign cause incremental outcomes?" with causal confidence. This is the method that proves OOH works (or doesn't) to a CFO or board.
3. Marketing Mix Modeling (MMM)
MMM uses regression-based analytics to decompose how each channel, including OOH, contributes to aggregate outcomes like revenue, sessions, or signups over time. You feed in daily or weekly spend and performance data across all channels, and the model estimates each channel's marginal contribution while accounting for seasonality, trends, and cross-channel interaction effects.
When combined with a geo holdout, MMM becomes significantly more powerful. The geo holdout provides a causal anchor (a clean incrementality read), and the MMM uses that anchor to calibrate its ongoing channel-level estimates. This is the feedback loop between incrementality testing and MMM that produces durable measurement rather than one-off reads.
Best for: Ongoing channel-level budget allocation, understanding cross-channel synergies, comparing OOH efficiency against digital channels in the same model.
4. Offline-to-Online Lift Measurement
This approach tracks whether offline OOH exposures drive online behaviors: direct website visits, branded search volume lifts, app downloads, or social engagement spikes. Methods include device-based location matching (anonymously linking mobile IDs near an OOH asset to subsequent online activity) and brand search volume analysis in OOH-heavy DMAs compared to non-OOH markets.
Best for: Understanding the digital halo effect of OOH campaigns. Useful as a complementary signal alongside geo holdout tests, but not sufficient on its own for causal claims.
The BlueAlpha Approach: Step-by-Step
This is the execution framework. Follow these phases in order.
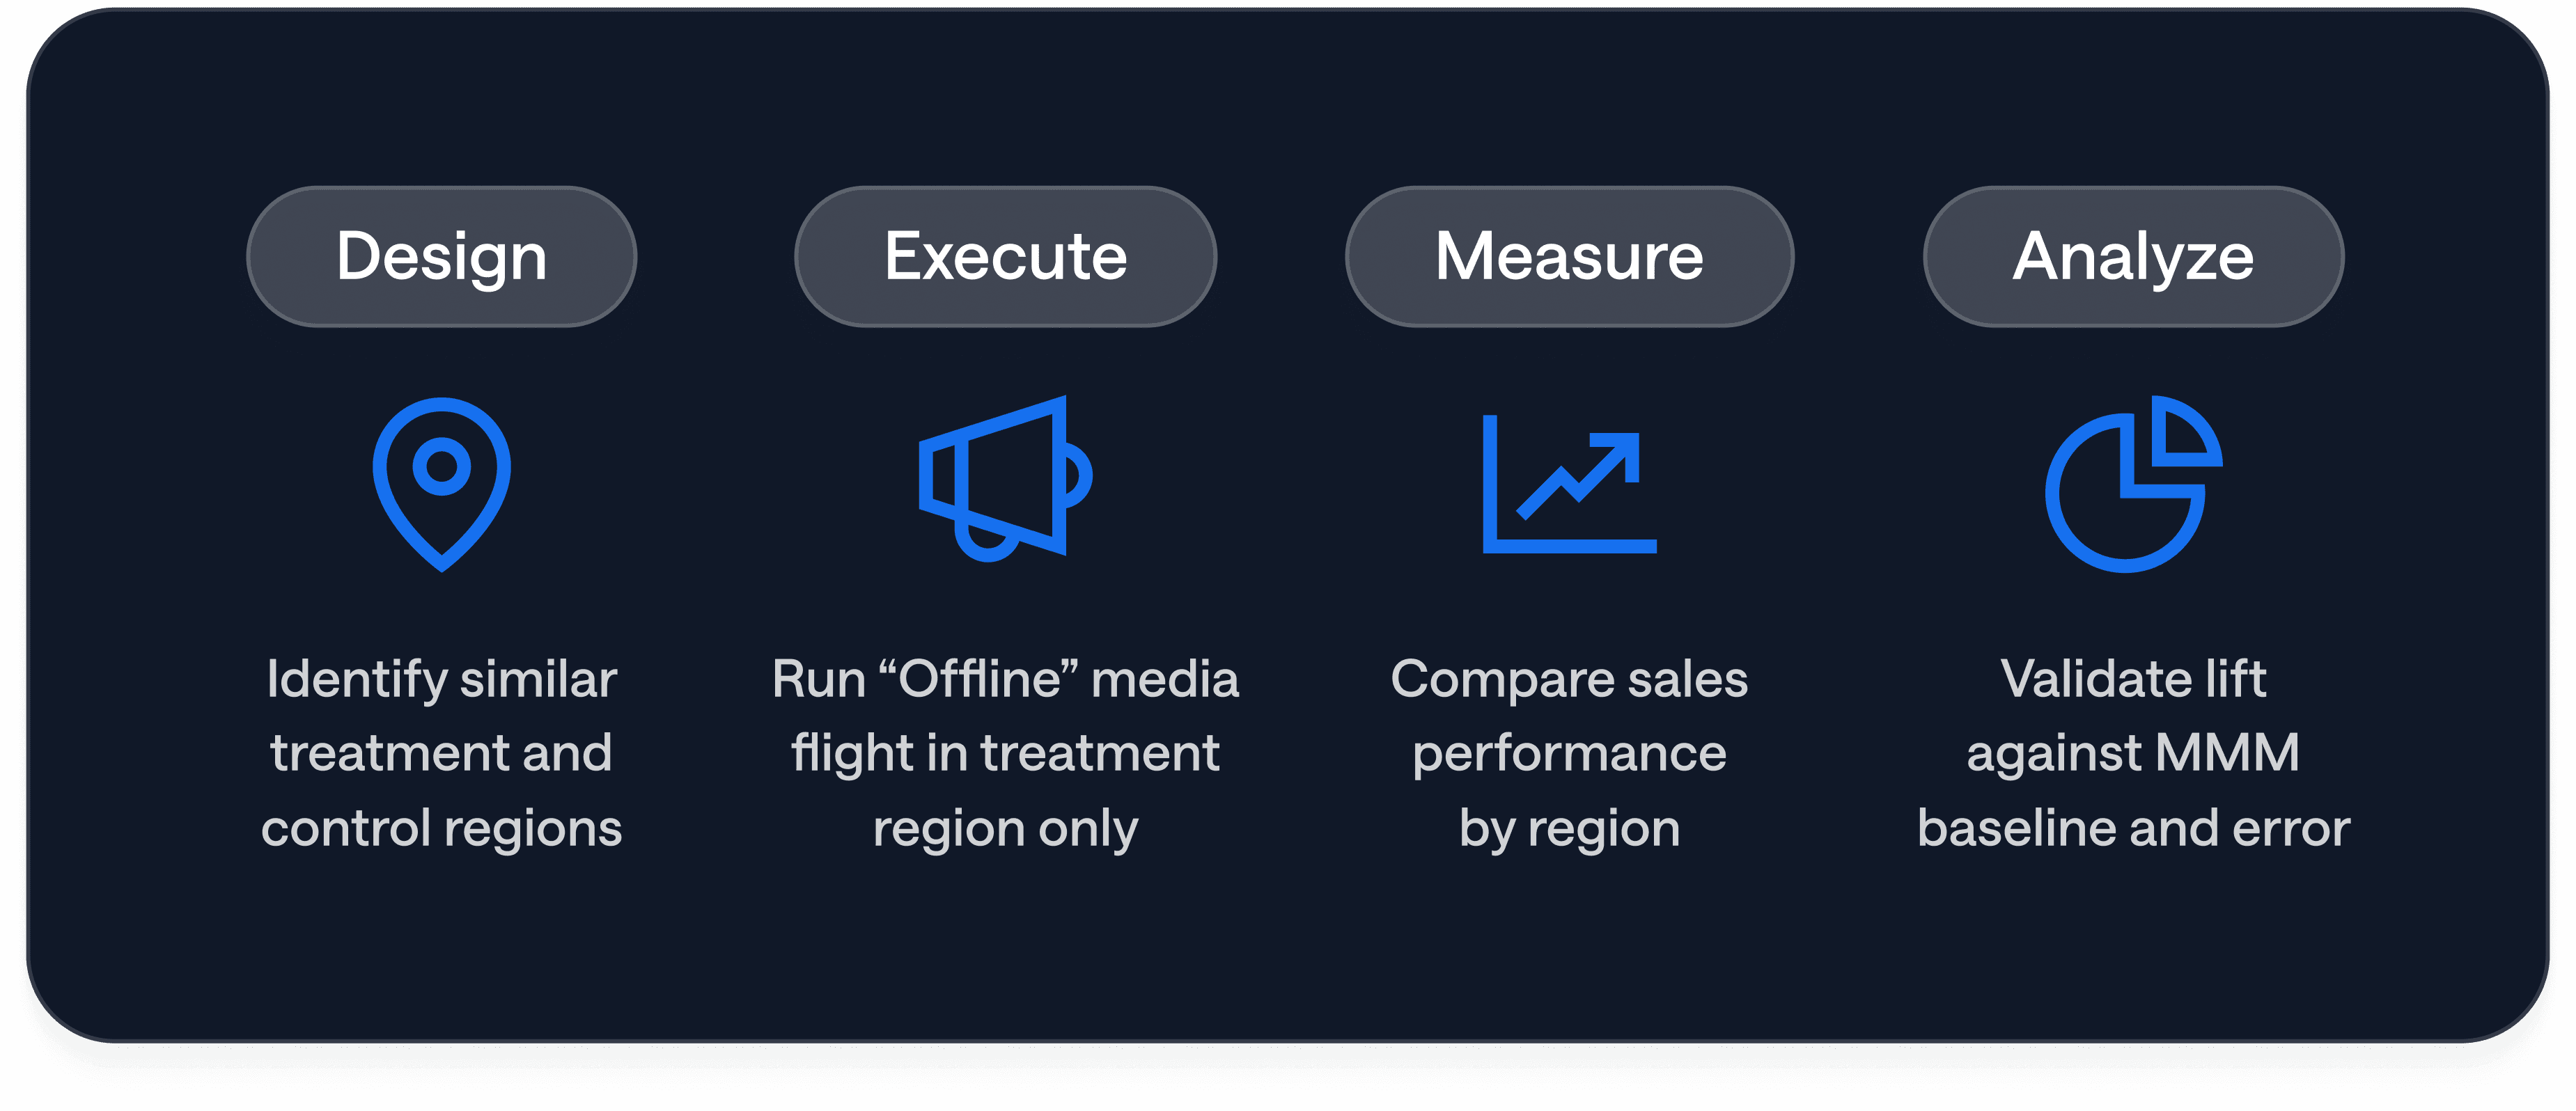
Phase 1: Define Your KPI Hierarchy
Before designing anything else, specify exactly what success looks like. OOH campaigns typically affect multiple funnel stages differently, so you need a primary KPI and secondary KPIs, established before the campaign launches.
A typical hierarchy:
KPI level | Metric | Why it matters |
|---|---|---|
Primary | New website users (or app installs) | Highest volume, most sensitive to OOH exposure, fastest to show signal |
Secondary | Signups / leads | Validates whether OOH-driven traffic converts |
Tertiary | Purchases / revenue | The ultimate ROI question, but often requires longer observation windows |
The primary KPI should be the one with the highest expected volume. OOH is predominantly an awareness channel, so upper-funnel metrics (traffic, new users) will show the clearest signal. Lower-funnel metrics (purchases) are critical for ROI calculations but may require larger budgets or longer flights to achieve statistical significance.
Do not skip this step or leave it vague. "We'll measure everything and see what moves" is a recipe for post-hoc rationalization, not measurement.
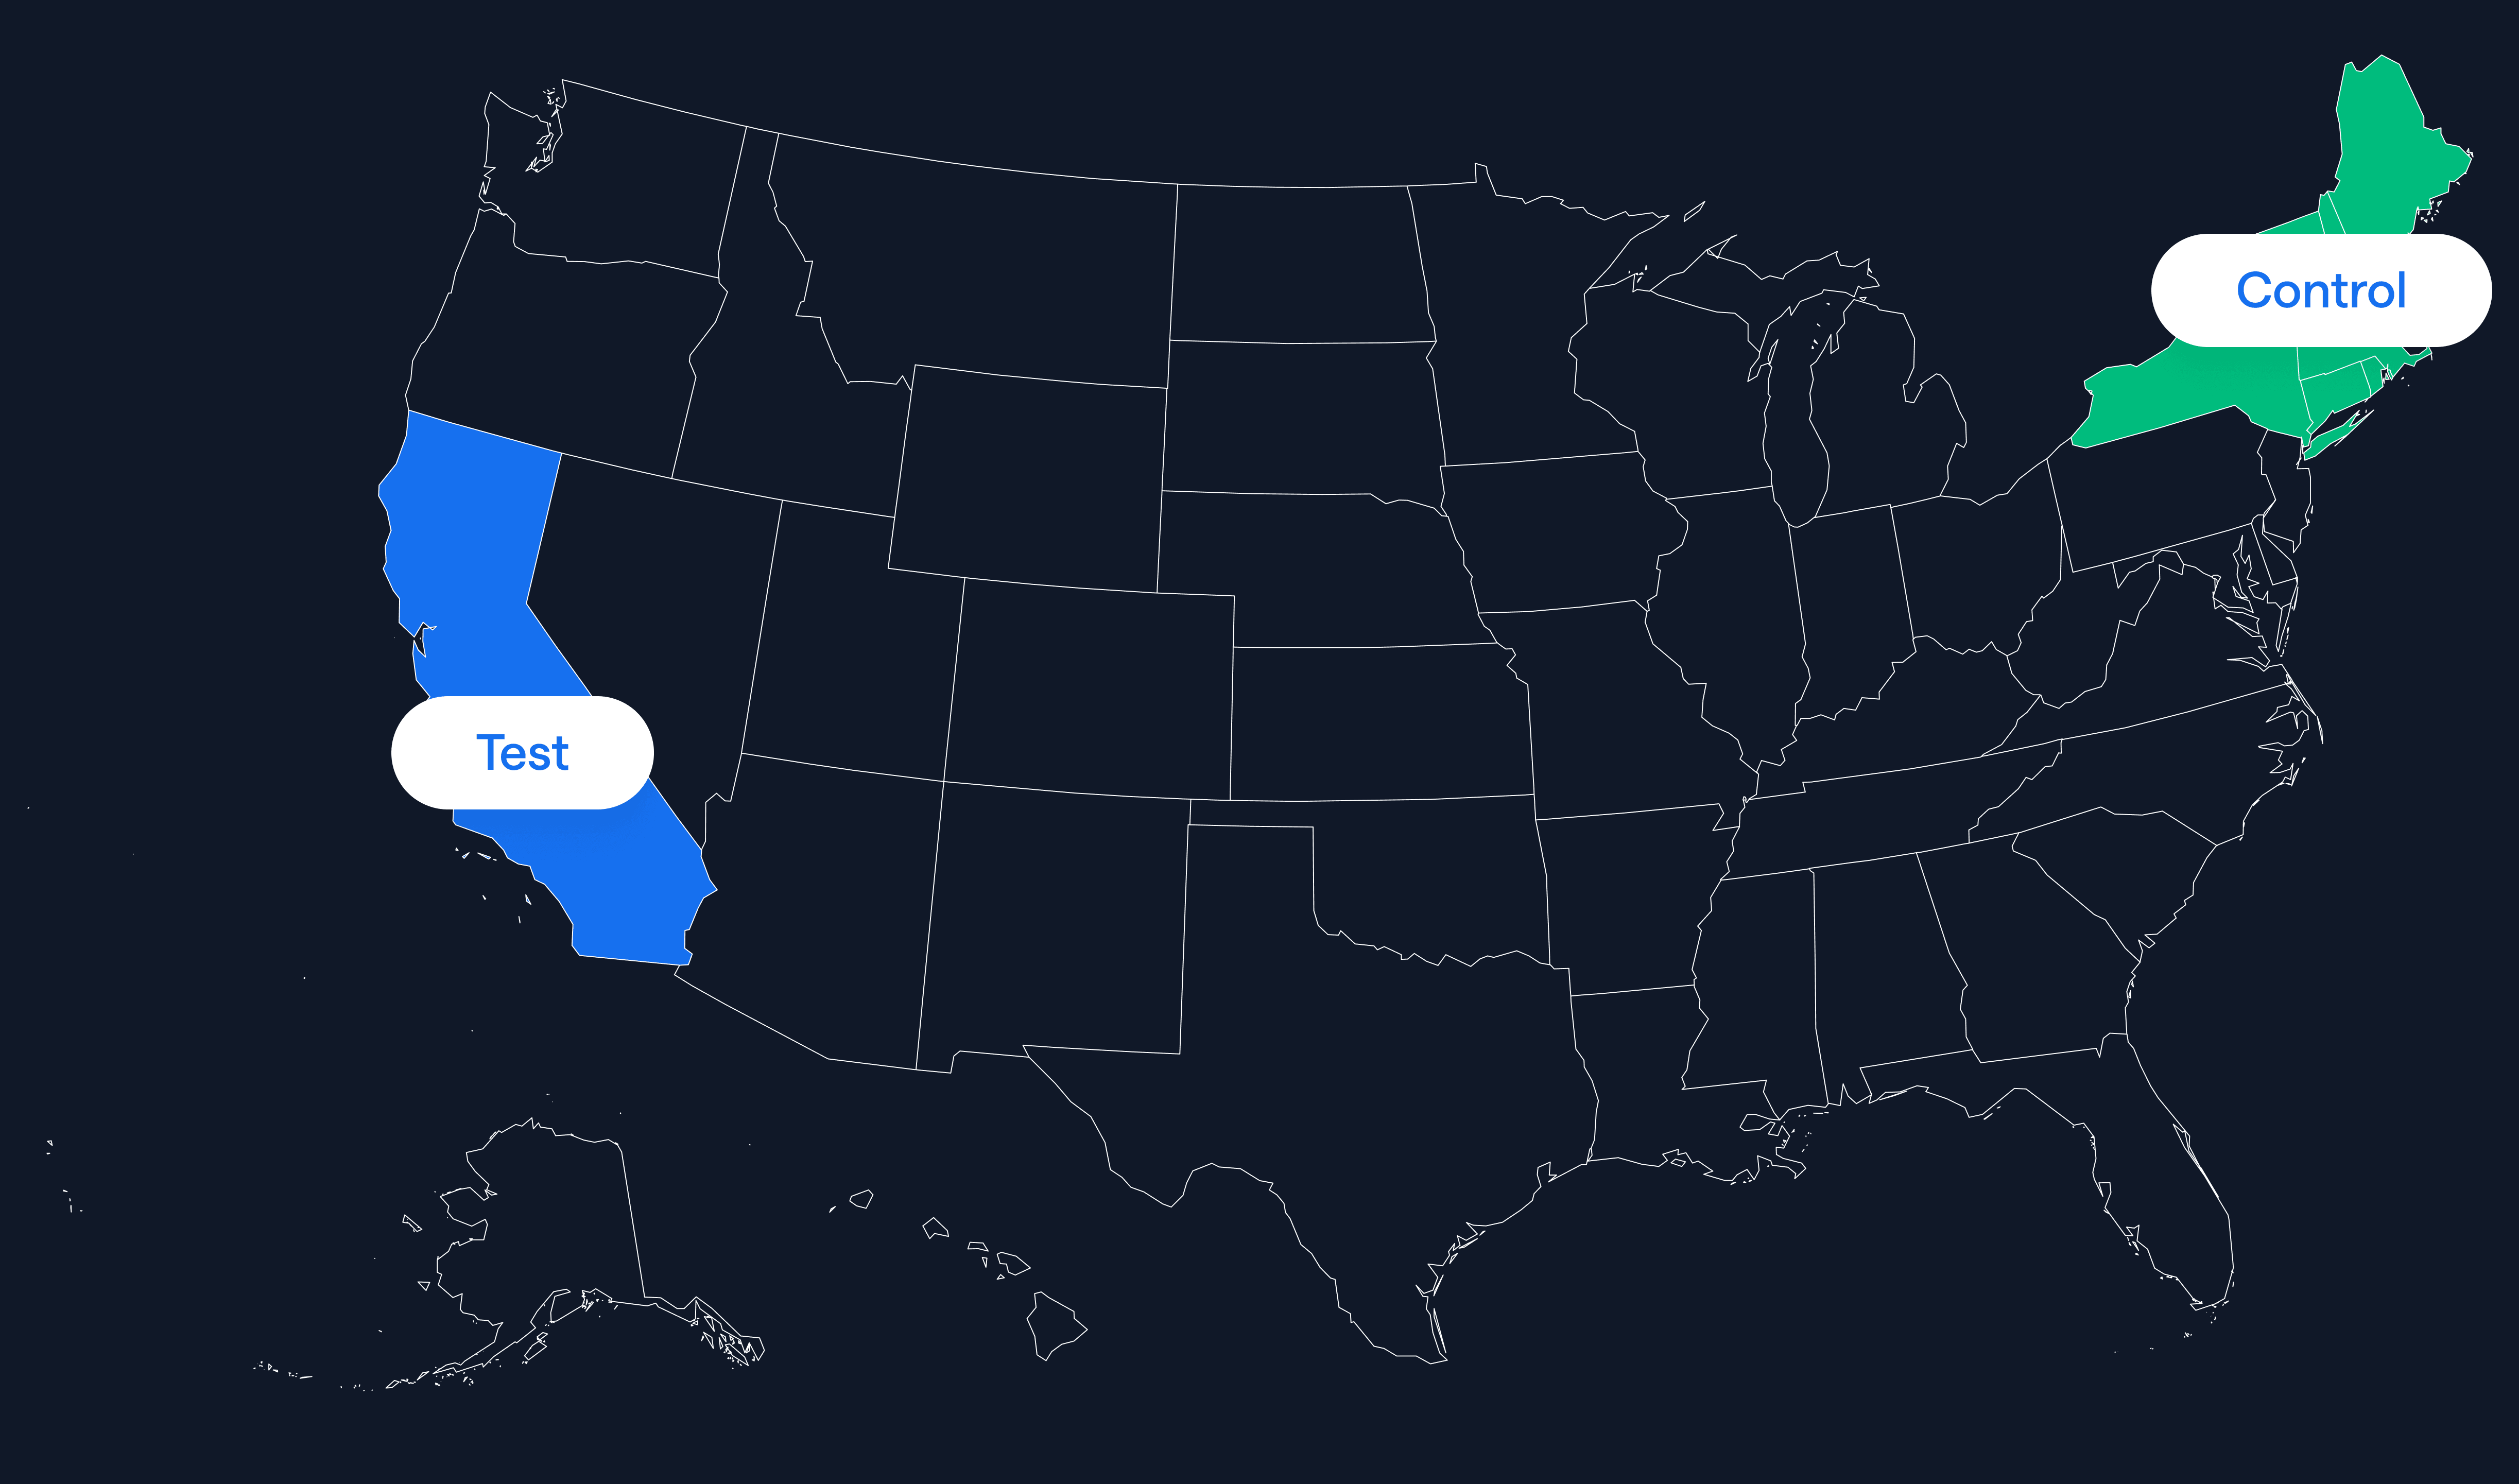
Phase 2: Select Test vs. Control Markets
This is the most consequential design decision. A poorly matched control market will produce noisy, unreliable results regardless of how sophisticated your modeling is.
Selection criteria:
Similar baseline performance. The control market should have web traffic, signup rates, and purchase patterns within 10% of the treatment market's baseline, measured over the 8-12 weeks before the campaign.
Similar population scale and composition. If your treatment market is New York City, your control should not be a rural county. Look for comparable metro areas or regions with similar demographics and market penetration.
No concurrent media changes. The control market must not have other significant media activity changes during the test window. If you are simultaneously launching a new paid social campaign in the control market, your geo holdout results will be contaminated.
Geographic independence. Treatment and control markets should not share media spillover zones. Adjacent DMAs with overlapping commuter populations will dilute your signal.
Example design: Run OOH creative across New York City subway stations (treatment). Hold out a comparable metro area like Philadelphia or Boston (control). If no single market is a good match, use a synthetic control composed of multiple smaller markets weighted to approximate the treatment market's baseline characteristics.
Retroactive holdouts. If your OOH campaign already ran and you did not plan a holdout, you can still perform a retroactive analysis. Identify any market or region where OOH did not run during the campaign window. As long as you have baseline data for that region, it can serve as a post-hoc control. The statistical power will be lower than a prospectively designed holdout, but a retroactive analysis is far better than no causal measurement at all.
Phase 3: Allocate Media and Run the Campaign
Even flight across the test window. Maintain consistent spend and impression delivery throughout the campaign period. Avoid front-loading or pulsing, which creates confounding time-based variance.
Minimum flight length: 4 weeks. Two-week bursts rarely generate enough signal to beat noise, especially for lower-funnel KPIs. Four weeks is the floor; six weeks is preferable if budget allows.
Track impressions and spend daily. Request daily frame-level or site-level as-delivered data from your OOH vendor. In your RFP, specify that you require data that meets current Geopath/OAAA recommended standards. This ensures apples-to-apples comparisons across formats (static billboards, bus shelters, digital signage, transit wraps).
Tag concurrent digital campaigns. If you are running any other media in either treatment or control markets during the test window, tag and log that spend separately. The MMM will need those inputs to isolate the OOH effect.
Phase 4: Collect Data and Model the Lift
Once the campaign flight ends, allow a 1-2 week cool-off period. OOH has a longer decay curve than most digital channels because it operates through brand recall rather than direct response. Someone who saw a subway panel on the last day of the flight may not Google your brand until the following week.
Data collection:
Export daily sessions, signups, and purchases by market from GA4 (or your analytics platform).
Compile daily OOH spend and impressions by market.
Compile all other channel spend and performance data by market for the same period.
Flag any anomalous events (holidays, PR events, outages, competitive launches) that might affect either market.
Modeling approach:
Option A: Geo holdout analysis only (no MMM). Compare the treatment market's observed outcomes against the control market's outcomes during the campaign window. The simplest version is a difference-in-differences approach: (Treatment_during - Treatment_before) - (Control_during - Control_before) = Incremental lift. For more rigor, use Bayesian structural time series or synthetic control methods, which account for pre-period trends and produce confidence intervals around the lift estimate.
Option B: MMM with geo dummy (recommended). Add a binary "treatment market x campaign period" variable to your marketing mix model specification. This variable isolates the OOH effect within the broader channel decomposition. The MMM simultaneously estimates OOH's contribution while controlling for all other channels, seasonality, and trend. Validate the lift estimate at 95% confidence. This is the approach that produced the beehiiv results.

Phase 5: Calculate Incremental CPA
With your lift estimates in hand, calculate the cost of each incremental outcome:
Incremental CPA = Total OOH Spend / Incremental Lift (at each funnel stage)
Build a results table for each KPI level:
Metric | Incremental Lift | Incremental CPA | Confidence Level |
|---|---|---|---|
New users | [lift estimate] | [spend / lift] | [e.g., 95%] |
Signups | [lift estimate] | [spend / lift] | [e.g., 95%] |
Purchases | [lift estimate] | [spend / lift] | [e.g., 95%] |
This table is the artifact that goes to the CFO. It translates OOH's impact into the same cost-per-acquisition language used for every digital channel.
A real-world example: In beehiiv's NYC subway campaign, the results table looked like this:
Metric | Incremental Lift | Incremental CPA | Confidence |
|---|---|---|---|
New users | ~100,000 | ~$4 | 95% |
Signups | ~100 | ~$2,700 | 95% |
Purchases | ~15-20 | ~$17,000 | 95% |
The interpretation: OOH delivered cost-efficient top-of-funnel awareness ($4 per incremental visitor is competitive with many digital channels), but conversion-stage CPA was well above the digital baseline. That clarity enabled a precise reallocation decision rather than a binary keep-or-kill debate.
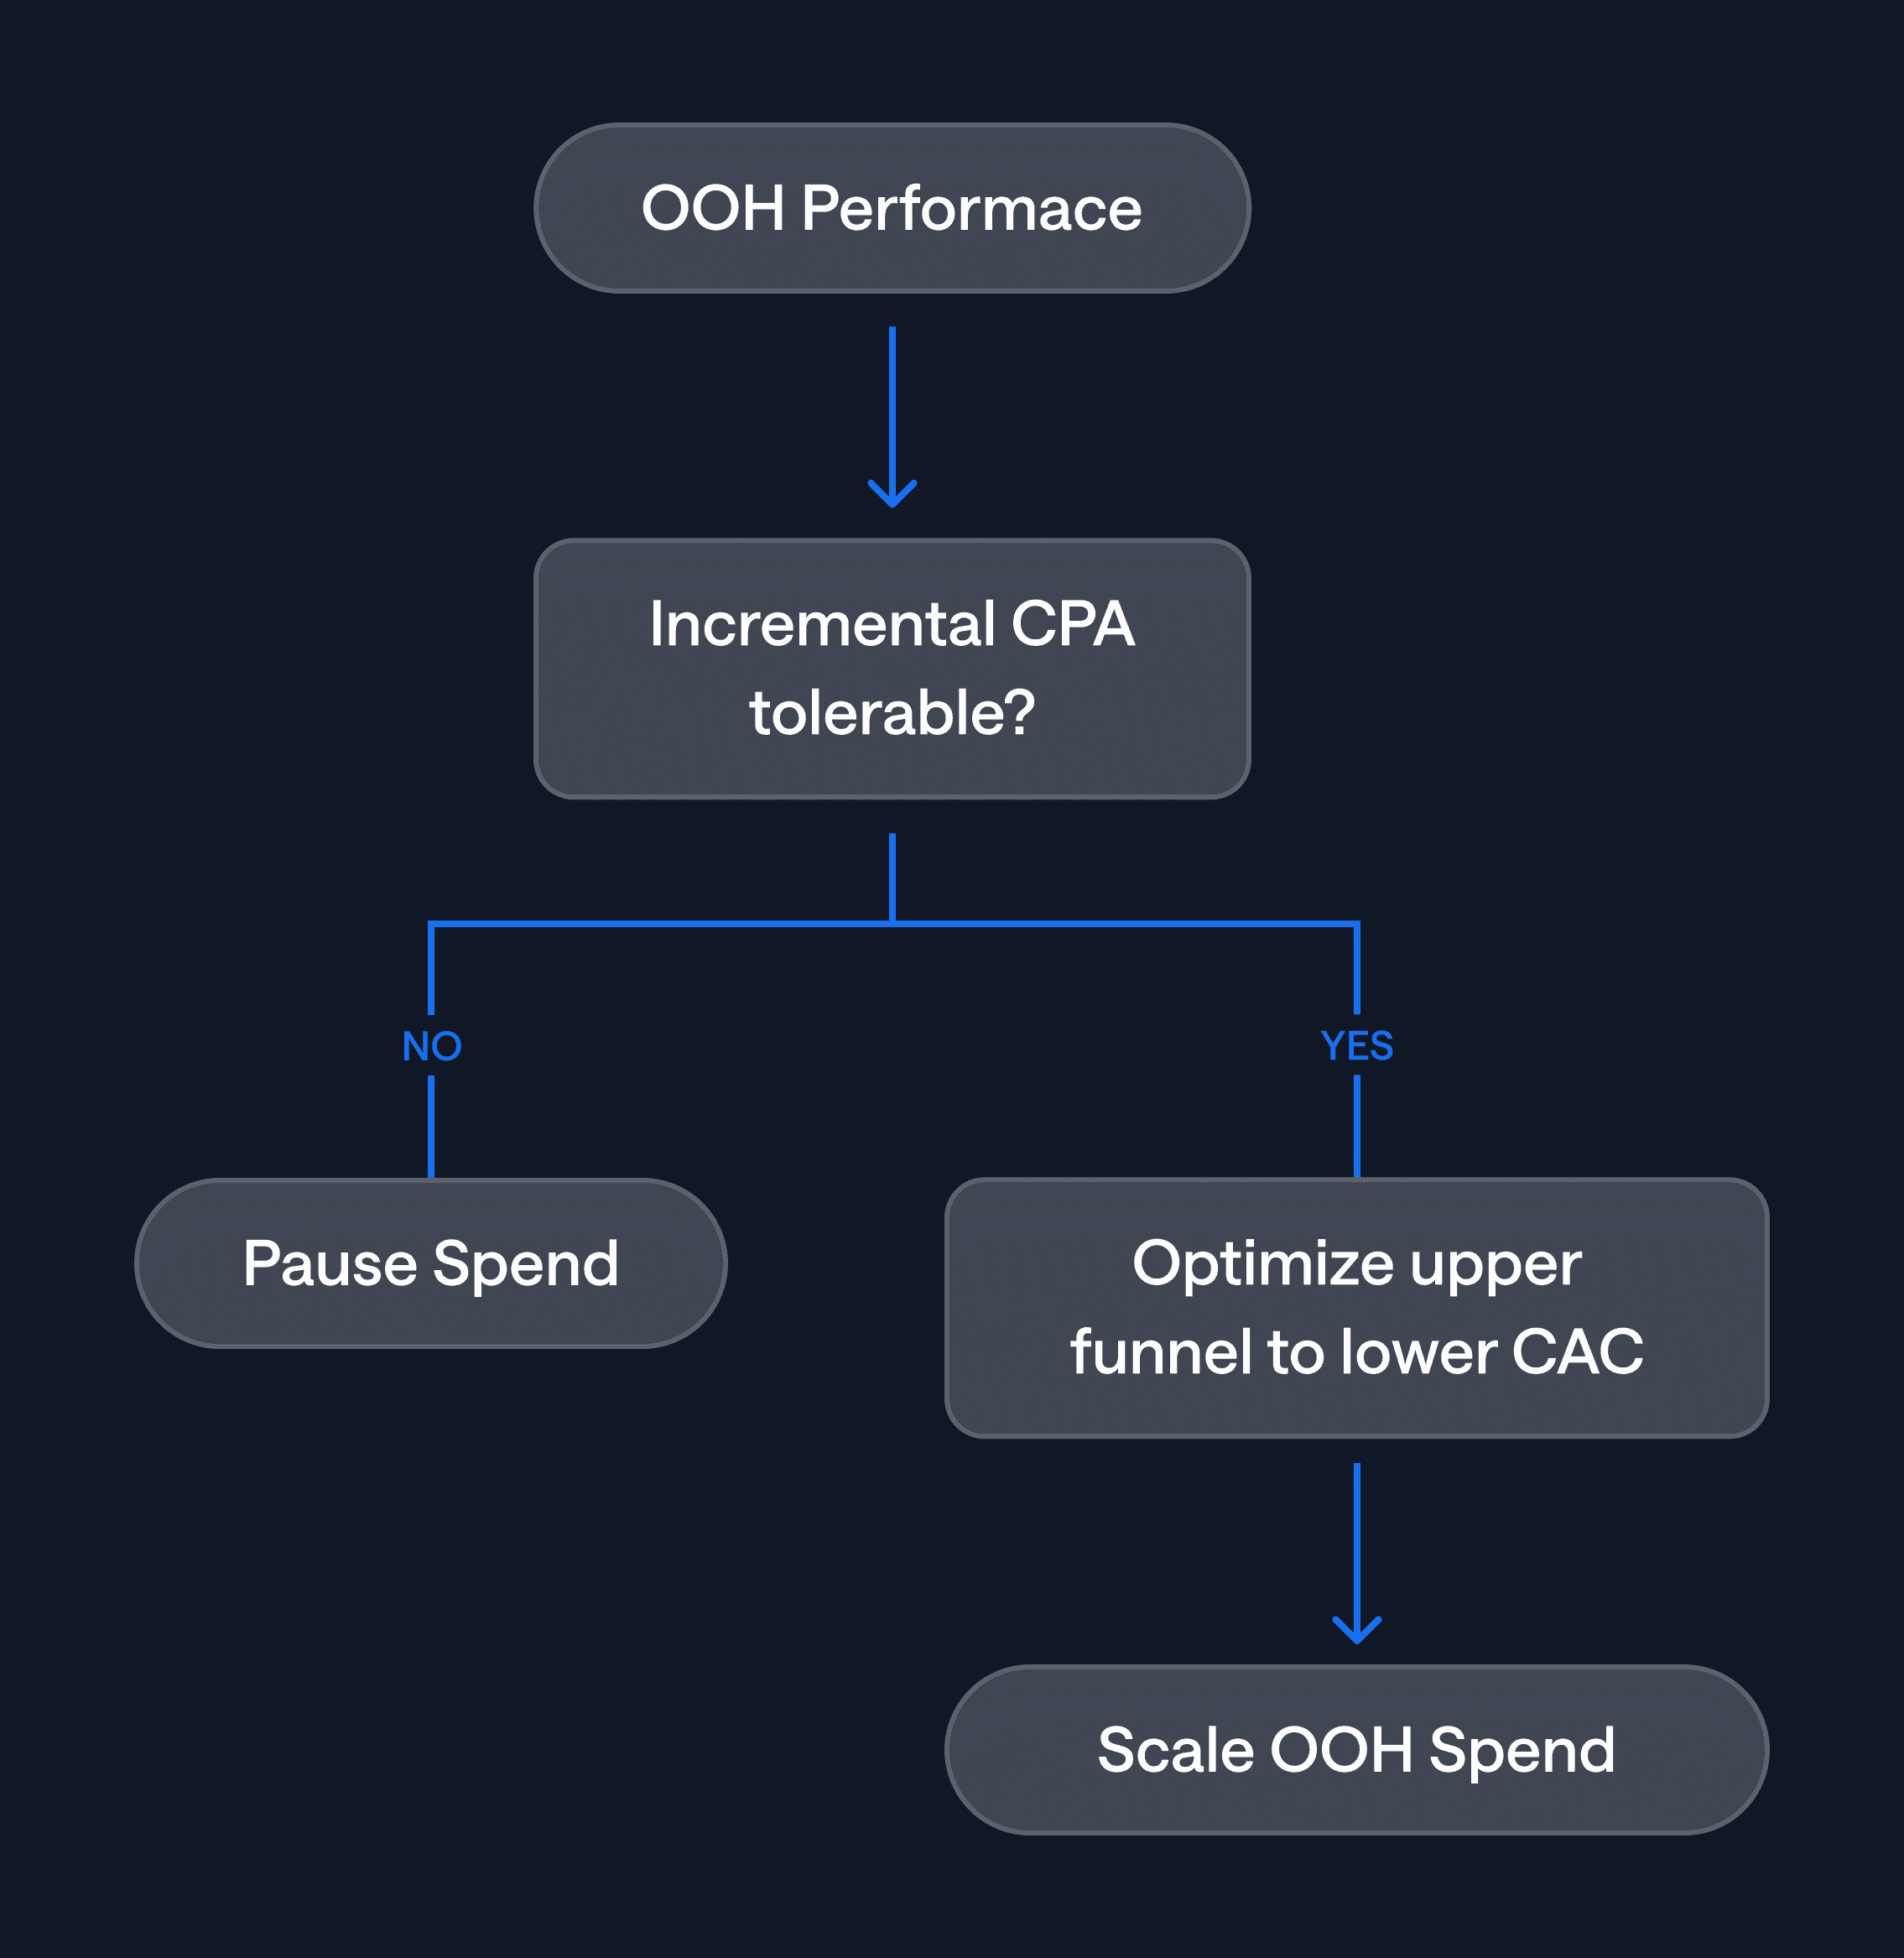
Phase 6: Decide
The measurement exists to drive a decision. Use this decision framework:
If traffic/awareness CPA is below your target: OOH is a cost-effective awareness channel. Consider maintaining it as a brand-building complement to your digital performance channels. Feed the validated OOH contribution back into your MMM to refine ongoing budget allocation.
If conversion CPA is above your target but traffic CPA is strong: OOH is generating real demand at the top of funnel, but conversion efficiency is lagging. Before pausing, test whether creative optimization, offer changes, or digital retargeting of OOH-exposed audiences can improve conversion rates. Consider a follow-up test with adjusted creative.
If both traffic and conversion CPA are above target: Pause OOH and reallocate budget to proven efficient channels. Document the results so the organization does not revisit the same question without new information.
If results are inconclusive (wide confidence intervals, ambiguous lift): The test was underpowered. Before concluding OOH doesn't work, evaluate whether a longer flight, larger budget, or better-matched control market would produce a clearer signal. If the test cost was substantial and the signal was still null, that is itself informative.
Understanding the OOH Metrics That Feed Your Model
When evaluating OOH campaign data and vendor proposals, these are the metrics that matter at each level of analysis.
Reach and Frequency
What percentage of your target audience saw the ad at least once (reach), and how many times on average did they see it (frequency). Modern OOH audience measurement platforms incorporate daily frame-level data and mobile location signals to calculate these dynamically rather than relying on legacy circulation estimates. When evaluating vendor proposals, ask for audience composition indices rather than raw traffic volume. A billboard that "indexes 125" for your target demo at a specific income threshold is more useful than a billboard with higher raw traffic but poor target alignment.
Foot Traffic Lift
For brands with physical retail locations, foot traffic lift analysis measures whether people exposed to an OOH ad subsequently visited a store. This is done by capturing anonymous mobile device IDs near the OOH asset and matching them to device appearances at retail locations. Compare exposed vs. unexposed foot traffic over time against a control region. This is most relevant for brick-and-mortar businesses and CPG brands, and less applicable to pure digital businesses.
Digital Engagement Lift
Track whether OOH exposure correlates with increases in direct type-in website traffic, branded search volume, social media mentions, or app downloads in the treatment market. Brand search volume lift in OOH-heavy DMAs compared to control markets is one of the cleanest digital halo signals. Dynamic QR codes and short links on OOH creative capture a partial direct-response signal but will systematically undercount the broader awareness effect.
Sales Lift
The ultimate metric. Measured either through the geo holdout framework described in this playbook (comparing treatment vs. control market sales) or through MMM decomposition of OOH's marginal contribution to revenue over time. For e-commerce businesses, this connects directly to your purchase data pipeline. For businesses with offline sales, you will need POS data by market.
Common Pitfalls to Avoid
Insufficient control market selection. Pick geos with 10% or less baseline variance from your treatment market. Large baseline differences between treatment and control make it difficult to attribute observed differences to OOH rather than pre-existing market dynamics.
Test windows that are too short. Two-week campaign bursts rarely generate enough signal to beat statistical noise, especially for lower-funnel metrics. Plan for a minimum of four weeks, plus a one-to-two week cool-off observation period after the flight ends.
Attribution overlap from concurrent campaigns. If you launch a new digital campaign in either the treatment or control market during the test window, you contaminate the results. Switch off local digital promotions in both markets or tag them separately so they can be controlled for in the model.
Ignoring confidence intervals. A positive lift estimate without statistical significance is noise, not signal. Report confidence intervals alongside point estimates. If your 95% confidence interval includes zero, you cannot claim the campaign generated incremental impact, even if the point estimate looks appealing.
Confusing impressions with impact. Vendor-reported impression data (even refined LTS data) tells you about exposure. It does not tell you about causation. Do not use impression metrics alone to justify OOH budget decisions. The geo holdout is what converts exposure data into causal evidence.
Retrofitting KPIs after seeing results. If you defined new website users as your primary KPI but the traffic lift is small and the signup lift looks better, resist the temptation to redefine success. State your hypothesis and primary KPI before the test runs. You can report all metrics, but the decision should anchor on the metric you committed to upfront.
Replication Checklist
✔︎ | Task |
|---|---|
☐ | Define primary & secondary KPIs (e.g., new users, sign-ups). |
☐ | Select ≥ 2 comparable markets for “test” vs “control”. |
☐ | Reserve offline media exclusively in test market for ≥ 4 weeks. |
☐ | Ensure daily (or weekly) outcome data by market flows into your data warehouse. |
☐ | Add a “geo x week” dummy to your MMM specification. |
☐ | Run model, verify ≥ 90% power, 95% confidence. |
☐ | Calculate incremental CPA for each funnel stage. |
☐ | Document spend-reallocation decision and next-step hypothesis. |
Integrating OOH Into Your Broader Measurement Stack
The geo holdout and MMM framework described in this playbook does not exist in isolation. Here is how OOH measurement connects to the rest of your marketing measurement infrastructure.
Feeding MMM Priors with Incrementality Results
If you run a Bayesian MMM, the geo holdout results from your OOH test can be used as informative priors for the OOH channel coefficient. This means your model does not have to estimate OOH's contribution from scratch every time; it starts from a calibrated, causally validated estimate and updates based on new data. This feedback loop between incrementality testing and MMM is what separates a one-off measurement exercise from a durable measurement system.
Cross-Channel Synergy Detection
OOH's primary effect is often not direct conversion but amplification of other channels. A consumer who sees a subway panel on their commute is more likely to click a paid search ad for the same brand later that day. If you include OOH as a variable in your MMM alongside digital channels, the model can detect these interaction effects and attribute the correct share of lift to each channel, including the synergy.
Unified Offline and Online Reporting
With OOH impression data, geo holdout results, and MMM channel contributions all flowing into the same analytics framework, you can report OOH performance in the same dashboard and the same language as your digital channels. This eliminates the "offline is a black box" dynamic and brings OOH into the same budget optimization conversation as paid search, paid social, and programmatic display.
A Real-World Example: beehiiv's NYC Subway Campaign
The framework in this playbook is the same one used to measure beehiiv's $300,000 New York City subway advertising campaign, the first statistically validated OOH incrementality study for the company.
The setup: beehiiv ran subway creative across NYC stations for four weeks while comparable metro areas served as control markets. Daily data capture across treatment and control regions tracked website users, signups, and purchases.
The modeling: Bayesian structural time series and synthetic control methods isolated OOH's causal impact from organic growth and concurrent digital campaigns. Weekly monitoring provided real-time visibility during the flight.
The results: ~100,000 incremental new website users at ~$4 CPA (95% confidence). ~100 incremental signups at ~$2,700 CPA. ~15-20 incremental purchases at ~$17,000 CPA.
The decision: OOH proved to be a cost-efficient awareness driver but an expensive direct-response channel at the observed spend level. The data enabled a precise reallocation decision: continue OOH as a brand-building tactic with clear budget thresholds, while shifting direct-response budgets back to proven digital channels.
As beehiiv's former Head of Growth EJ White put it:
"Nobody has ever been able to do that before. Everyone has anecdotal stuff, but no one has been able to show us that it actually worked. It drove an increase in actual performance."
Read the full beehiiv OOH case study →
Next Steps
If you already have OOH running or planned: Run through the Replication Checklist above and start designing your geo holdout. The most common first step is confirming you have daily outcome data by market and identifying your control region.
If you want help designing and running the test: BlueAlpha's measurement framework handles the experiment design, data architecture, statistical modeling, and decision recommendations. Book a demo to walk through your specific OOH scenario.
PLAYBOOK
Get this case study as a PDF
Why This Playbook Exists
Out-of-home advertising is one of the few remaining channels where large budgets are routinely deployed without causal measurement. Billboards, subway panels, bus shelters, and digital signage saturate the physical environment, but the question that matters most to the marketing team goes unanswered: did this spend actually drive incremental business outcomes, or are we just entertaining commuters?
The gap is not data availability. Modern OOH measurement standards from Geopath, OAAA, and the MRC now enable daily frame-level impression forecasting with near-digital precision. Mobile location signals, connected vehicles, and programmatic DOOH platforms generate usable audience data. The gap is methodology: knowing how many people walked past a billboard tells you nothing about whether those exposures caused someone to visit your site, sign up, or buy.
This playbook solves that problem. It walks you through a proven framework for measuring OOH campaigns using geo holdout experiments and marketing mix modeling (MMM), the same approach that produced the first statistically validated OOH measurement study for beehiiv's $300K NYC subway campaign, which uncovered ~100,000 incremental new users at 95% statistical confidence.
You will leave this playbook knowing how to design a geo holdout test, select the right metrics, model causal lift, calculate incremental CPA at every funnel stage, and make a data-backed decision about whether to scale, refine, or pause your offline spend.
Who This Playbook Is For
Use case | Signals it fits |
|---|---|
First offline test (OOH, transit, print, DOOH) | $20K+ media budget, clear geographic targeting options |
Board or CFO asks "show me the impact" | Need statistical confidence before scaling |
Need to compare offline to digital ROI | MMM already running for digital channels, or planning to start |
Evaluating whether to expand OOH into new markets | Need a replicable measurement framework across cities |
OOH vendor says "trust our impression data" | Want independent, causal validation beyond vendor-reported metrics |
Prerequisites
Before you begin, confirm you have the following in place:
Daily or weekly outcome data by market. Web sessions, signups, and purchases (or your equivalent funnel stages) segmented by geography. GA4 with geo-level views is the most common source.
Ability to withhold media in at least one comparable geo region. You need a control market where OOH does not run. If your campaign is already live everywhere, a retroactive geo holdout analysis is still possible if you have at least one market without OOH exposure (see Phase 2 below).
OOH spend and impression data at daily or weekly granularity. Ask your vendor for daily frame-level or site-level as-delivered data. If they can only provide flight-level totals, you can still proceed, but your model resolution will be lower.
MMM tooling that supports geo-level variables. You need the ability to add a binary "treatment x time period" variable (a geo dummy) to your marketing mix model. If you do not have MMM infrastructure, the geo holdout test alone still produces a valid incrementality read.
A primary KPI defined before the campaign starts. Do not retrofit your success metric after seeing results.
The OOH Measurement Problem: Why Impressions Alone Are Not Enough
Before jumping into the test design, it helps to understand why OOH measurement is structurally harder than digital, and why the standard OOH metrics your vendor reports are necessary but insufficient.
OOH Is Not Clickable
Digital measurement rests on a direct signal: someone clicked, converted, or abandoned. OOH generates no click. There is no pixel, no cookie, no device-level conversion event tied to a billboard exposure. That does not mean OOH is unmeasurable. It means measurement requires a different toolkit: one built around geographic experiments and statistical modeling rather than user-level tracking.
Vendor-Reported Impressions Measure Exposure, Not Impact
The OOH industry has developed a layered hierarchy of impression definitions, each progressively more precise:
Impressions (circulation). The raw count of people who pass the OOH asset. This is the baseline metric and the one most vendors report by default. It tells you potential audience size but says nothing about whether anyone noticed, remembered, or acted on the ad.
Opportunity to See (OTS). Sometimes called "viewable impressions." This filters the raw count to include only passersby for whom the ad was physically visible: not obstructed, properly illuminated, within the viewer's line of sight. This is the OOH equivalent of digital viewability standards.
Likelihood to See (LTS). The most refined tier. LTS applies probability models factoring in dwell time, viewing angle, speed of traffic, and environmental context to estimate how many people likely noticed the ad. Some vendors reference eye-tracking studies or dwell-time analytics to calibrate these probabilities.
Each step up this ladder is more precise. But even LTS, the most advanced standard impression metric, answers "how many people probably saw this?" It does not answer "did seeing this cause them to do anything they would not have done otherwise?" That is the incrementality question, and it requires a different approach.
Low-Reliability Direct Response Methods
QR codes, vanity URLs, and promo codes capture only the small fraction of people who consciously take an immediate action in response to OOH exposure. These methods systematically undercount OOH's actual contribution because the channel's primary effect is awareness and brand recall, not immediate direct response. A person who sees a subway ad on Monday and Googles your brand on Wednesday will never show up in your QR code scan data. Building an OOH measurement strategy around direct response tracking alone will consistently undervalue the channel.
The One-to-Many Problem
A single billboard is visible to thousands of passersby across multiple demographic segments, commute patterns, and levels of attention. That broad coverage is a strength for brand building, but it makes metrics like duplication (the same person seeing the same ad multiple times across different formats) and dwell time difficult to isolate at the individual level. Standardized audience measurement frameworks help, but they quantify exposure distribution, not business outcomes.
The Four Methods for Measuring OOH Performance
The right OOH measurement approach depends on what question you are trying to answer. These four methods are complementary, not competing. A comprehensive strategy uses impression data as the base layer and layers on causal methods to connect exposure to outcomes.
1. Impression and Audience Data
The foundational layer. At minimum, you track how many people were exposed to the OOH asset using the impression hierarchy described above (raw impressions, OTS, or LTS). Modern OOH platforms integrate mobile location signals and connected-vehicle data to produce audience composition breakdowns: age, income, commute patterns, and interest segments.
This data is essential for planning and vendor evaluation. It does not, on its own, tell you whether the campaign worked.
Best for: Media planning, vendor comparison, reach and frequency estimation, post-campaign reporting on exposure levels.
2. Geo Holdout Testing (Incrementality)
The core method this playbook teaches. You run your OOH campaign in one or more treatment markets while withholding media from comparable control markets. By comparing outcomes (site visits, signups, purchases) between treatment and control, you isolate the causal lift attributable to OOH.
This is the same experimental logic used in clinical trials: treatment vs. control, with statistical significance thresholds applied to the observed difference.
Best for: Answering "did this campaign cause incremental outcomes?" with causal confidence. This is the method that proves OOH works (or doesn't) to a CFO or board.
3. Marketing Mix Modeling (MMM)
MMM uses regression-based analytics to decompose how each channel, including OOH, contributes to aggregate outcomes like revenue, sessions, or signups over time. You feed in daily or weekly spend and performance data across all channels, and the model estimates each channel's marginal contribution while accounting for seasonality, trends, and cross-channel interaction effects.
When combined with a geo holdout, MMM becomes significantly more powerful. The geo holdout provides a causal anchor (a clean incrementality read), and the MMM uses that anchor to calibrate its ongoing channel-level estimates. This is the feedback loop between incrementality testing and MMM that produces durable measurement rather than one-off reads.
Best for: Ongoing channel-level budget allocation, understanding cross-channel synergies, comparing OOH efficiency against digital channels in the same model.
4. Offline-to-Online Lift Measurement
This approach tracks whether offline OOH exposures drive online behaviors: direct website visits, branded search volume lifts, app downloads, or social engagement spikes. Methods include device-based location matching (anonymously linking mobile IDs near an OOH asset to subsequent online activity) and brand search volume analysis in OOH-heavy DMAs compared to non-OOH markets.
Best for: Understanding the digital halo effect of OOH campaigns. Useful as a complementary signal alongside geo holdout tests, but not sufficient on its own for causal claims.
The BlueAlpha Approach: Step-by-Step
This is the execution framework. Follow these phases in order.
Phase 1: Define Your KPI Hierarchy
Before designing anything else, specify exactly what success looks like. OOH campaigns typically affect multiple funnel stages differently, so you need a primary KPI and secondary KPIs, established before the campaign launches.
A typical hierarchy:
KPI level | Metric | Why it matters |
|---|---|---|
Primary | New website users (or app installs) | Highest volume, most sensitive to OOH exposure, fastest to show signal |
Secondary | Signups / leads | Validates whether OOH-driven traffic converts |
Tertiary | Purchases / revenue | The ultimate ROI question, but often requires longer observation windows |
The primary KPI should be the one with the highest expected volume. OOH is predominantly an awareness channel, so upper-funnel metrics (traffic, new users) will show the clearest signal. Lower-funnel metrics (purchases) are critical for ROI calculations but may require larger budgets or longer flights to achieve statistical significance.
Do not skip this step or leave it vague. "We'll measure everything and see what moves" is a recipe for post-hoc rationalization, not measurement.
Phase 2: Select Test vs. Control Markets
This is the most consequential design decision. A poorly matched control market will produce noisy, unreliable results regardless of how sophisticated your modeling is.
Selection criteria:
Similar baseline performance. The control market should have web traffic, signup rates, and purchase patterns within 10% of the treatment market's baseline, measured over the 8-12 weeks before the campaign.
Similar population scale and composition. If your treatment market is New York City, your control should not be a rural county. Look for comparable metro areas or regions with similar demographics and market penetration.
No concurrent media changes. The control market must not have other significant media activity changes during the test window. If you are simultaneously launching a new paid social campaign in the control market, your geo holdout results will be contaminated.
Geographic independence. Treatment and control markets should not share media spillover zones. Adjacent DMAs with overlapping commuter populations will dilute your signal.
Example design: Run OOH creative across New York City subway stations (treatment). Hold out a comparable metro area like Philadelphia or Boston (control). If no single market is a good match, use a synthetic control composed of multiple smaller markets weighted to approximate the treatment market's baseline characteristics.
Retroactive holdouts. If your OOH campaign already ran and you did not plan a holdout, you can still perform a retroactive analysis. Identify any market or region where OOH did not run during the campaign window. As long as you have baseline data for that region, it can serve as a post-hoc control. The statistical power will be lower than a prospectively designed holdout, but a retroactive analysis is far better than no causal measurement at all.
Phase 3: Allocate Media and Run the Campaign
Even flight across the test window. Maintain consistent spend and impression delivery throughout the campaign period. Avoid front-loading or pulsing, which creates confounding time-based variance.
Minimum flight length: 4 weeks. Two-week bursts rarely generate enough signal to beat noise, especially for lower-funnel KPIs. Four weeks is the floor; six weeks is preferable if budget allows.
Track impressions and spend daily. Request daily frame-level or site-level as-delivered data from your OOH vendor. In your RFP, specify that you require data that meets current Geopath/OAAA recommended standards. This ensures apples-to-apples comparisons across formats (static billboards, bus shelters, digital signage, transit wraps).
Tag concurrent digital campaigns. If you are running any other media in either treatment or control markets during the test window, tag and log that spend separately. The MMM will need those inputs to isolate the OOH effect.
Phase 4: Collect Data and Model the Lift
Once the campaign flight ends, allow a 1-2 week cool-off period. OOH has a longer decay curve than most digital channels because it operates through brand recall rather than direct response. Someone who saw a subway panel on the last day of the flight may not Google your brand until the following week.
Data collection:
Export daily sessions, signups, and purchases by market from GA4 (or your analytics platform).
Compile daily OOH spend and impressions by market.
Compile all other channel spend and performance data by market for the same period.
Flag any anomalous events (holidays, PR events, outages, competitive launches) that might affect either market.
Modeling approach:
Option A: Geo holdout analysis only (no MMM). Compare the treatment market's observed outcomes against the control market's outcomes during the campaign window. The simplest version is a difference-in-differences approach: (Treatment_during - Treatment_before) - (Control_during - Control_before) = Incremental lift. For more rigor, use Bayesian structural time series or synthetic control methods, which account for pre-period trends and produce confidence intervals around the lift estimate.
Option B: MMM with geo dummy (recommended). Add a binary "treatment market x campaign period" variable to your marketing mix model specification. This variable isolates the OOH effect within the broader channel decomposition. The MMM simultaneously estimates OOH's contribution while controlling for all other channels, seasonality, and trend. Validate the lift estimate at 95% confidence. This is the approach that produced the beehiiv results.
Phase 5: Calculate Incremental CPA
With your lift estimates in hand, calculate the cost of each incremental outcome:
Incremental CPA = Total OOH Spend / Incremental Lift (at each funnel stage)
Build a results table for each KPI level:
Metric | Incremental Lift | Incremental CPA | Confidence Level |
|---|---|---|---|
New users | [lift estimate] | [spend / lift] | [e.g., 95%] |
Signups | [lift estimate] | [spend / lift] | [e.g., 95%] |
Purchases | [lift estimate] | [spend / lift] | [e.g., 95%] |
This table is the artifact that goes to the CFO. It translates OOH's impact into the same cost-per-acquisition language used for every digital channel.
A real-world example: In beehiiv's NYC subway campaign, the results table looked like this:
Metric | Incremental Lift | Incremental CPA | Confidence |
|---|---|---|---|
New users | ~100,000 | ~$4 | 95% |
Signups | ~100 | ~$2,700 | 95% |
Purchases | ~15-20 | ~$17,000 | 95% |
The interpretation: OOH delivered cost-efficient top-of-funnel awareness ($4 per incremental visitor is competitive with many digital channels), but conversion-stage CPA was well above the digital baseline. That clarity enabled a precise reallocation decision rather than a binary keep-or-kill debate.
Phase 6: Decide
The measurement exists to drive a decision. Use this decision framework:
If traffic/awareness CPA is below your target: OOH is a cost-effective awareness channel. Consider maintaining it as a brand-building complement to your digital performance channels. Feed the validated OOH contribution back into your MMM to refine ongoing budget allocation.
If conversion CPA is above your target but traffic CPA is strong: OOH is generating real demand at the top of funnel, but conversion efficiency is lagging. Before pausing, test whether creative optimization, offer changes, or digital retargeting of OOH-exposed audiences can improve conversion rates. Consider a follow-up test with adjusted creative.
If both traffic and conversion CPA are above target: Pause OOH and reallocate budget to proven efficient channels. Document the results so the organization does not revisit the same question without new information.
If results are inconclusive (wide confidence intervals, ambiguous lift): The test was underpowered. Before concluding OOH doesn't work, evaluate whether a longer flight, larger budget, or better-matched control market would produce a clearer signal. If the test cost was substantial and the signal was still null, that is itself informative.
Understanding the OOH Metrics That Feed Your Model
When evaluating OOH campaign data and vendor proposals, these are the metrics that matter at each level of analysis.
Reach and Frequency
What percentage of your target audience saw the ad at least once (reach), and how many times on average did they see it (frequency). Modern OOH audience measurement platforms incorporate daily frame-level data and mobile location signals to calculate these dynamically rather than relying on legacy circulation estimates. When evaluating vendor proposals, ask for audience composition indices rather than raw traffic volume. A billboard that "indexes 125" for your target demo at a specific income threshold is more useful than a billboard with higher raw traffic but poor target alignment.
Foot Traffic Lift
For brands with physical retail locations, foot traffic lift analysis measures whether people exposed to an OOH ad subsequently visited a store. This is done by capturing anonymous mobile device IDs near the OOH asset and matching them to device appearances at retail locations. Compare exposed vs. unexposed foot traffic over time against a control region. This is most relevant for brick-and-mortar businesses and CPG brands, and less applicable to pure digital businesses.
Digital Engagement Lift
Track whether OOH exposure correlates with increases in direct type-in website traffic, branded search volume, social media mentions, or app downloads in the treatment market. Brand search volume lift in OOH-heavy DMAs compared to control markets is one of the cleanest digital halo signals. Dynamic QR codes and short links on OOH creative capture a partial direct-response signal but will systematically undercount the broader awareness effect.
Sales Lift
The ultimate metric. Measured either through the geo holdout framework described in this playbook (comparing treatment vs. control market sales) or through MMM decomposition of OOH's marginal contribution to revenue over time. For e-commerce businesses, this connects directly to your purchase data pipeline. For businesses with offline sales, you will need POS data by market.
Common Pitfalls to Avoid
Insufficient control market selection. Pick geos with 10% or less baseline variance from your treatment market. Large baseline differences between treatment and control make it difficult to attribute observed differences to OOH rather than pre-existing market dynamics.
Test windows that are too short. Two-week campaign bursts rarely generate enough signal to beat statistical noise, especially for lower-funnel metrics. Plan for a minimum of four weeks, plus a one-to-two week cool-off observation period after the flight ends.
Attribution overlap from concurrent campaigns. If you launch a new digital campaign in either the treatment or control market during the test window, you contaminate the results. Switch off local digital promotions in both markets or tag them separately so they can be controlled for in the model.
Ignoring confidence intervals. A positive lift estimate without statistical significance is noise, not signal. Report confidence intervals alongside point estimates. If your 95% confidence interval includes zero, you cannot claim the campaign generated incremental impact, even if the point estimate looks appealing.
Confusing impressions with impact. Vendor-reported impression data (even refined LTS data) tells you about exposure. It does not tell you about causation. Do not use impression metrics alone to justify OOH budget decisions. The geo holdout is what converts exposure data into causal evidence.
Retrofitting KPIs after seeing results. If you defined new website users as your primary KPI but the traffic lift is small and the signup lift looks better, resist the temptation to redefine success. State your hypothesis and primary KPI before the test runs. You can report all metrics, but the decision should anchor on the metric you committed to upfront.
Replication Checklist
✔︎ | Task |
|---|---|
☐ | Define primary & secondary KPIs (e.g., new users, sign-ups). |
☐ | Select ≥ 2 comparable markets for “test” vs “control”. |
☐ | Reserve offline media exclusively in test market for ≥ 4 weeks. |
☐ | Ensure daily (or weekly) outcome data by market flows into your data warehouse. |
☐ | Add a “geo x week” dummy to your MMM specification. |
☐ | Run model, verify ≥ 90% power, 95% confidence. |
☐ | Calculate incremental CPA for each funnel stage. |
☐ | Document spend-reallocation decision and next-step hypothesis. |
Integrating OOH Into Your Broader Measurement Stack
The geo holdout and MMM framework described in this playbook does not exist in isolation. Here is how OOH measurement connects to the rest of your marketing measurement infrastructure.
Feeding MMM Priors with Incrementality Results
If you run a Bayesian MMM, the geo holdout results from your OOH test can be used as informative priors for the OOH channel coefficient. This means your model does not have to estimate OOH's contribution from scratch every time; it starts from a calibrated, causally validated estimate and updates based on new data. This feedback loop between incrementality testing and MMM is what separates a one-off measurement exercise from a durable measurement system.
Cross-Channel Synergy Detection
OOH's primary effect is often not direct conversion but amplification of other channels. A consumer who sees a subway panel on their commute is more likely to click a paid search ad for the same brand later that day. If you include OOH as a variable in your MMM alongside digital channels, the model can detect these interaction effects and attribute the correct share of lift to each channel, including the synergy.
Unified Offline and Online Reporting
With OOH impression data, geo holdout results, and MMM channel contributions all flowing into the same analytics framework, you can report OOH performance in the same dashboard and the same language as your digital channels. This eliminates the "offline is a black box" dynamic and brings OOH into the same budget optimization conversation as paid search, paid social, and programmatic display.
A Real-World Example: beehiiv's NYC Subway Campaign
The framework in this playbook is the same one used to measure beehiiv's $300,000 New York City subway advertising campaign, the first statistically validated OOH incrementality study for the company.
The setup: beehiiv ran subway creative across NYC stations for four weeks while comparable metro areas served as control markets. Daily data capture across treatment and control regions tracked website users, signups, and purchases.
The modeling: Bayesian structural time series and synthetic control methods isolated OOH's causal impact from organic growth and concurrent digital campaigns. Weekly monitoring provided real-time visibility during the flight.
The results: ~100,000 incremental new website users at ~$4 CPA (95% confidence). ~100 incremental signups at ~$2,700 CPA. ~15-20 incremental purchases at ~$17,000 CPA.
The decision: OOH proved to be a cost-efficient awareness driver but an expensive direct-response channel at the observed spend level. The data enabled a precise reallocation decision: continue OOH as a brand-building tactic with clear budget thresholds, while shifting direct-response budgets back to proven digital channels.
As beehiiv's former Head of Growth EJ White put it:
"Nobody has ever been able to do that before. Everyone has anecdotal stuff, but no one has been able to show us that it actually worked. It drove an increase in actual performance."
Read the full beehiiv OOH case study →
Next Steps
If you already have OOH running or planned: Run through the Replication Checklist above and start designing your geo holdout. The most common first step is confirming you have daily outcome data by market and identifying your control region.
If you want help designing and running the test: BlueAlpha's measurement framework handles the experiment design, data architecture, statistical modeling, and decision recommendations. Book a demo to walk through your specific OOH scenario.
PLAYBOOK
Get this case study as a PDF
