What Is Incrementality in Marketing? A Worked Example
Incrementality is the revenue you would lose if a channel went dark. BlueAlpha's geo tests found Meta off by 345%, TikTok by 10% the other way.
What Is Incrementality in Marketing? A Worked Example
Incrementality is the share of a result that would not have happened without the marketing that claims it. If a campaign reports 20,000 orders and 16,000 of those customers would have bought anyway, the campaign's incremental contribution is 4,000 orders, not 20,000. Every reported number in every ad platform is a claim about credit. Incrementality is the measurement of cause.
Most people meet the word because someone else raised it first. A CFO asking how much of last quarter would have happened anyway. An agency proposing a test. A board deck with a number nobody in the room can defend. What follows is what the term means, why platform numbers diverge from it in both directions, how it gets measured, and when it is the right question to ask.
What Incrementality Means, and the Question It Answers
Incrementality answers one question: what would have happened if we had not run this?
That question is harder than it sounds, because you cannot observe both outcomes. You ran the campaign, so you can see the world where it ran. The world where it did not run is unobservable. Measuring incrementality means constructing a credible estimate of that second world, called a counterfactual, and comparing the two.
Everything else follows from that. A conversion that would have happened anyway is not incremental, no matter which platform reported it or how confident the report looks. A conversion that happened because of the ad is incremental, even if no tracking system connected the two.
The word gets used loosely, so three related terms are worth separating. Incremental lift is the size of the difference between the observed world and the counterfactual, usually expressed as a percentage or an absolute count. Incrementality is the property being measured. Incremental CAC or incremental ROAS divide spend by the incremental result rather than the reported one, which is why they are almost always worse than the platform figures they replace.
Why Reported Numbers and Incremental Numbers Diverge
Ad platforms do not measure incrementality. They measure attribution, which assigns credit for conversions the platform observed. Those are different operations, and the gap between them is structural rather than a bug.
A platform sees the touchpoints inside its own walls. It cannot see the email that arrived that morning, the podcast ad from last month, or the fact that the customer was already searching for the product. It also cannot always see its own conversions: when the ad is served on mobile and the purchase happens on desktop, the platform's own tracking loses the thread. When someone converts after seeing a Meta ad and clicking a Google ad and opening an email, all three systems can claim the same sale. Add up what every platform reports and you routinely get more revenue than the business actually booked. One head of growth named the arithmetic: "if we add up Google's conversions and meta conversions we get more conversions than we're actually counting."
Retargeting is the sharpest version of this. An ad shown to someone already on the way to checkout will post an outstanding return. It did not create the purchase. It documented one.
Platforms Overstate and Understate, Which Is the Part Most Teams Miss
The usual framing is that platforms inflate their own performance. That is often true and it is not the whole picture. Measured against a counterfactual, reported numbers are wrong in both directions, and which direction depends on the channel.
When we ran geo tests across four channels for the newsletter platform beehiiv, Meta's true incremental cost per signup came in roughly 345% higher than Meta reported, at 93% confidence. The platform was claiming credit for signups that would have happened anyway. On the same tests, TikTok's incremental cost per signup was about 10% lower than TikTok reported, at 99% confidence. TikTok was undercounting its own contribution. Looking at paid-plan purchases rather than signups, Meta's platform reported effectively zero conversions during the test window while the test detected double-digit incremental purchases at 94% confidence. beehiiv's performance marketing lead, Brian Kudler, named the mechanic behind that gap: "For Meta, there's a lot of site traffic on mobile, and people who start a newsletter aren't gonna do that on mobile. So it looks bad when you look at the deterministic data."
One brand, one test programme, three different directions of error, and one channel that produced no read at all. This is why a single blended correction factor does not work, and why "platforms exaggerate" is too simple a rule to run a budget on. You have to measure per channel.
Channel | Incremental vs platform-reported signup CPA | Confidence |
|---|---|---|
TikTok | About 10% lower. The platform undercounted itself | 99% |
YouTube | About 50% higher | 100% |
Meta | About 345% higher | 93% |
No read. Conversion volume too low to detect an effect | 60% |
The LinkedIn row matters as much as the Meta row. A test that comes back inconclusive is a real outcome, and it is the one no measurement vendor puts in a case study.
Triple Whale Said 4.77x. The Holdout Measured Zero
Consider a channel that looks unambiguously healthy. Spend is steady, the dashboard reports a strong return, and the team treats it as a core part of the mix.
That was the situation at Cann, a cannabis beverage brand selling direct to consumers, with AppLovin. The platform's own dashboard swung between 2x and 16x ROAS depending on the day. For December specifically, AppLovin's own reporting showed 1.25. Triple Whale, the third-party tool the team treated as the neutral referee, showed 4.77 for the same month. Two sources, both suggesting a channel worth scaling.
A 19-day geo holdout turned AppLovin off in five states and measured against Shopify transactions rather than modeled conversions. The test found no statistically significant lift at that spend level. The point estimate was positive at $90,000. The 95% credible interval ran from negative $152,000 to positive $310,000, which is another way of saying the measured effect could not be distinguished from zero. Cann paused the channel and moved roughly $40,000 a month into Google, reallocating about $480,000 a year.
The detail worth sitting with: the independent third-party number was further from the truth than the platform's own. Blending does not equal accuracy. Both were modeled conversions, and neither observed a counterfactual.
How Incrementality Gets Measured: Geo Tests and Mix Models
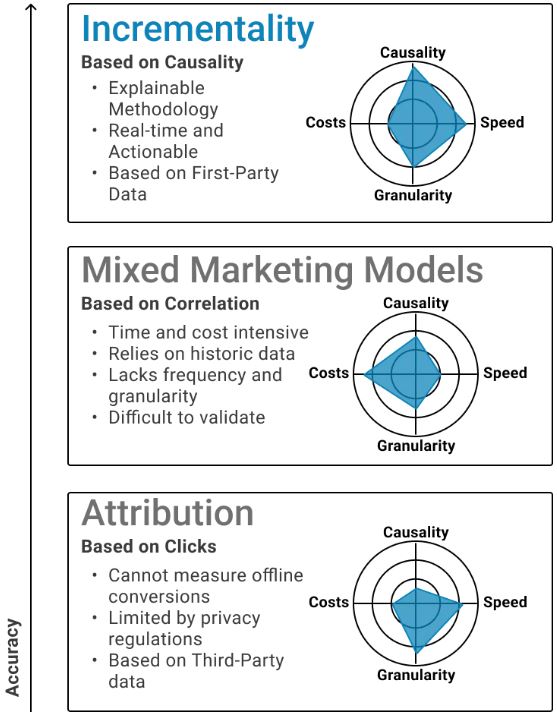
Two families of method produce credible counterfactuals. They answer different questions and work best together.
Geo-based experiments turn a channel off, or on, in a set of markets and compare the treated markets against a synthetic control built from the held-out ones. This is the closest thing to a controlled experiment available in live media, and it produces a direct causal read on one channel at a time. The right tool when the question is "is this specific channel doing anything." The trade-off is that it takes weeks and covers one question per test. The matched market testing guide covers the design decisions in detail. For the operational steps from power analysis through result interpretation, see the incrementality testing guide.
Marketing mix models estimate how revenue responds to spend across every channel at once, using aggregate data rather than user-level tracking. That means they cover offline and unattributable channels no pixel can reach. A Bayesian model with channel-specific adstock and saturation curves produces uncertainty intervals rather than false-precision point estimates, so you can see how much confidence any individual channel's read deserves. The marketing mix modeling guide covers the methodology.
The two reinforce each other. Test results update the model's priors, and the model tells you which channel is worth testing next. A model that has never been anchored to an experiment is a correlation engine. An experiment programme with no model behind it answers one question at a time and never builds a picture of the whole budget.
Neither can be read off a platform dashboard, because the platform does not know what would have happened without it.
What Incrementality Does Not Tell You On Its Own
Knowing a channel is incremental is not the same as knowing what to do next, and this is where teams stall after their first test.
An incrementality result is a statement about a specific channel, at a specific spend level, in a specific period. AppLovin produced no measurable lift for Cann at roughly $10,000 a week. That is not a verdict on AppLovin generally, and it is not a verdict on AppLovin for Cann at four times the spend. Haus, a separate measurement provider, has published positive AppLovin lift for four brands, one of them spending roughly $60,000 a week against Cann's $10,000. Spend level is the variable doing the work here, not the platform. Incrementality is spend-dependent because channels saturate. Early dollars reach the people most likely to convert. Later dollars reach people progressively less likely to, and at some point an additional dollar returns less than it costs.
Which means the budget question is always marginal. The question is what the next dollar in this channel returns, compared with the next dollar somewhere else. A channel can be genuinely incremental in aggregate and still be the wrong place for more money.
That is the step that turns measurement into a decision, and it is the step most measurement programmes never reach.
When Incrementality Is the Right Question, and When It Is Not
Incrementality is worth the effort when the answer changes what you do. Three situations qualify.
Your measurement systems disagree. When platform reporting, an internal attribution model and an MMM point in different directions, adding a fourth opinion does not break the tie. An experiment does, because it observes a counterfactual rather than modeling one.
A channel is large enough that being wrong is expensive. The cost of a test scales with the spend it protects. Testing a channel running $500 a month is not worth the weeks; testing one running $40,000 a month usually is.
Reported returns look too good to be true. They frequently are, and the pattern is consistent enough to be a useful trigger.
It is the wrong question in three cases. When conversion volume is too low to detect a realistic effect. When the channel is too small for the result to change a decision. And when you already know what you will do regardless of the answer. A test whose result changes nothing is a research project, not a measurement programme.
From Proving Incrementality to Acting On What It Says
There is a version of the marketing leader who spends the quarter assembling evidence that last quarter's budget was defensible. Screenshots from four platforms, a blended number finance accepts, a story that holds until someone asks a harder question. Measurement, in that mode, is something you produce after the fact to justify decisions already made.
The alternative is running the budget like a portfolio. Knowing the return on each position, knowing which position deserves the next dollar, and rebalancing continuously because the proof is in hand. Not defending last quarter. Deploying this one.
Incrementality is the input that makes the second version possible. It is also only an input. A causal read that arrives ninety days after the decision window has closed describes a media landscape that no longer exists, which is why cadence matters as much as rigour. At BlueAlpha the model refits weekly, tests feed their results back into it, and the resulting changes reach the ad accounts rather than a deck. That loop runs in the decision layer.
Where to Start If You Have Never Measured Incrementality
If you have never measured incrementality, do not start with a programme. Start with one test on the channel where being wrong is most expensive. That is usually your largest channel, or the one whose reported returns nobody quite believes. Anchor everything else to that result.
BlueAlpha builds the model and runs the tests, then wires the outcome into the accounts so the decision reaches the platform. We start with the channel you argue about most. Book a channel performance audit and we will show you what your reported numbers are hiding.
Figures in this article come from BlueAlpha's published case studies. Cann's geo holdout ran 19 days across five holdout states in January 2026, measured against Shopify transaction data. beehiiv's tests covered four channels over approximately six weeks, with confidence levels stated per channel. Reported ROAS and CPA figures are quoted as the source systems reported them.
FAQ
What is incrementality in marketing?
Incrementality is the share of a result that would not have occurred without the marketing that claims credit for it. It is measured by comparing what happened against a credible estimate of what would have happened otherwise, called a counterfactual. Unlike platform-reported conversions, which assign credit for observed touchpoints, incrementality establishes cause. In plain terms: if you turned a channel off tomorrow, incrementality is the revenue you would actually lose. The gap between that figure and what the platform reports is frequently large, and it is not consistent from channel to channel.
How do you prove incrementality?
You prove incrementality by constructing a counterfactual and comparing it against what actually happened. Geo-based experiments do this by turning a channel off in matched markets and measuring whether outcomes drop. If the 95% credible interval for the difference excludes zero, the channel is provably incremental. If the interval spans zero, as it did in Cann's AppLovin test, the effect cannot be distinguished from noise regardless of what the platform dashboard reports.
What is incremental lift?
Incremental lift is the measured size of the difference between the observed outcome and the counterfactual, usually expressed as a percentage or an absolute count of conversions or revenue. A credible lift figure comes with an uncertainty interval. A point estimate on its own can support almost any conclusion. Cann's AppLovin test showed a positive point estimate of $90,000 alongside a 95% credible interval spanning negative $152,000 to positive $310,000. The interval, not the point estimate, revealed the effect to be indistinguishable from zero.
What is the difference between attribution and incrementality?
Attribution assigns credit for conversions a system observed, distributing it across touchpoints according to a rule. Incrementality asks whether the conversion would have happened without the marketing at all. The two can give opposite answers for the same channel: a touchpoint can receive full attribution credit and contribute zero incremental value. That gap is the most common way budgets end up misallocated.
Do ad platforms overstate or understate incrementality?
Both, depending on the channel. In beehiiv's four-channel test programme, Meta's true incremental signup CPA was roughly 345% higher than reported while TikTok's was about 10% lower than reported. Direction and magnitude vary by channel, spend level and conversion event, which is why per-channel measurement is necessary and a single blended correction factor does not work.
How do you measure incrementality?
Two methods produce credible counterfactuals. Geo-based experiments turn a channel off in matched markets and compare against a synthetic control. Marketing mix models estimate response across all channels from aggregate data. Experiments give a precise causal read on one channel; models cover the whole budget including offline channels. Used together, test results calibrate the model and the model prioritises the next test.
When should an advertiser use incrementality measurement?
When the answer would change a decision. The strongest triggers are measurement systems that disagree with each other, a channel large enough that being wrong is costly, and reported returns that look implausibly good. It is the wrong tool when conversion volume is too low to detect a realistic effect, or when the channel is too small to change what you do.

