1440: Scaling Subscriber Growth Without Tanking Payback Rate
1440's quality-adjusted MMM found which channels drove engaged power readers vs. low-quality signups. Meta scaled to ~$650K/month, payback rate intact.

Incrementality Proven
Wasted Spend Eliminated
Spend Scaled Profitably

"Before BlueAlpha, our data was scattered, making it hard to clearly demonstrate impact. We believed Meta was working, but belief alone doesn’t secure the budget. Now I have a tool that shows exactly how everything’s performing — and that clarity is worth more than any dashboard."


Erika Burghardt Vice President of Growth at 1440
BlueAlpha built a weekly-refresh Bayesian MMM with quality-adjusted response curves for 1440, one of the largest daily news digests in the U.S. The model proved Meta as the primary growth driver (roughly 60% of total contribution, lowest CAC), revealed that LiveIntent had a negative correlation with digest signup growth despite consuming significant budget, and measured organic social contribution for the first time. 1440 used the results to scale Meta spend to approximately $650K per month, eliminate LiveIntent, and turn off underperforming Google PMax campaigns.
1440: 4M+ Subscribers, Payback Rate as North Star
1440 is a daily news digest reaching over 4 million subscribers at the time of the engagement, with a goal of 5 million. The marketing team, led by Erika Burghardt (VP of Growth), ran a multi-channel operation across Meta, LiveIntent, beehiiv, Google (Search, PMax, YouTube), and affiliate partnerships. The team tracked payback rates by channel (their North Star for subscriber quality: anything over 9% first-month payback is good, anything under gets flagged) and managed weekly ad budgets exceeding six figures on Meta alone.
As Erika described the starting position: "We believed Meta was working, but belief alone doesn't secure the budget. Now I have a tool that shows exactly how everything's performing."
Measuring Subscriber Quality by Channel at Scale
Erika called it "my biggest battle: finding the right mix of scalability at efficiency." The tension was specific to newsletter economics: advertiser revenue depends on engaged subscribers who open, click, and generate ad impressions. Acquiring cheap subscribers who never open degrades list quality and erodes advertiser confidence.
Erika described the pressure directly: "Some of our advertisers are like, 'Hey, you guys aren't growing as fast as you were. What's going on?' - but we don't want to bring on a bunch of low-quality subscribers just to say that we have 5 million and then it hurts us in the long run because they don't open, they don't click, and then we don't see that money in revenue."
The measurement gap compounded this tension. Platform reports, GA4, and internal models each told a different story. Meta claimed conversions. Google PMax claimed conversions. LiveIntent claimed conversions. But CAC kept rising and internal data showed quality declining on some channels. The team could not answer which channels were actually driving incremental digest signups vs. claiming credit for subscribers who would have signed up organically. As Erika put it: "I trust Google's in-platform metrics more than I trust Meta's," but neither source gave her a definitive answer.
A critical blind spot: 1440 posts roughly seven times per day across Instagram and Facebook, publishes weekly YouTube videos, and runs broadcast channels. None of this organic activity appeared in any measurement system. It was absorbed into "baseline" and ignored, which meant paid channels were likely getting credit for some organic-driven signups.
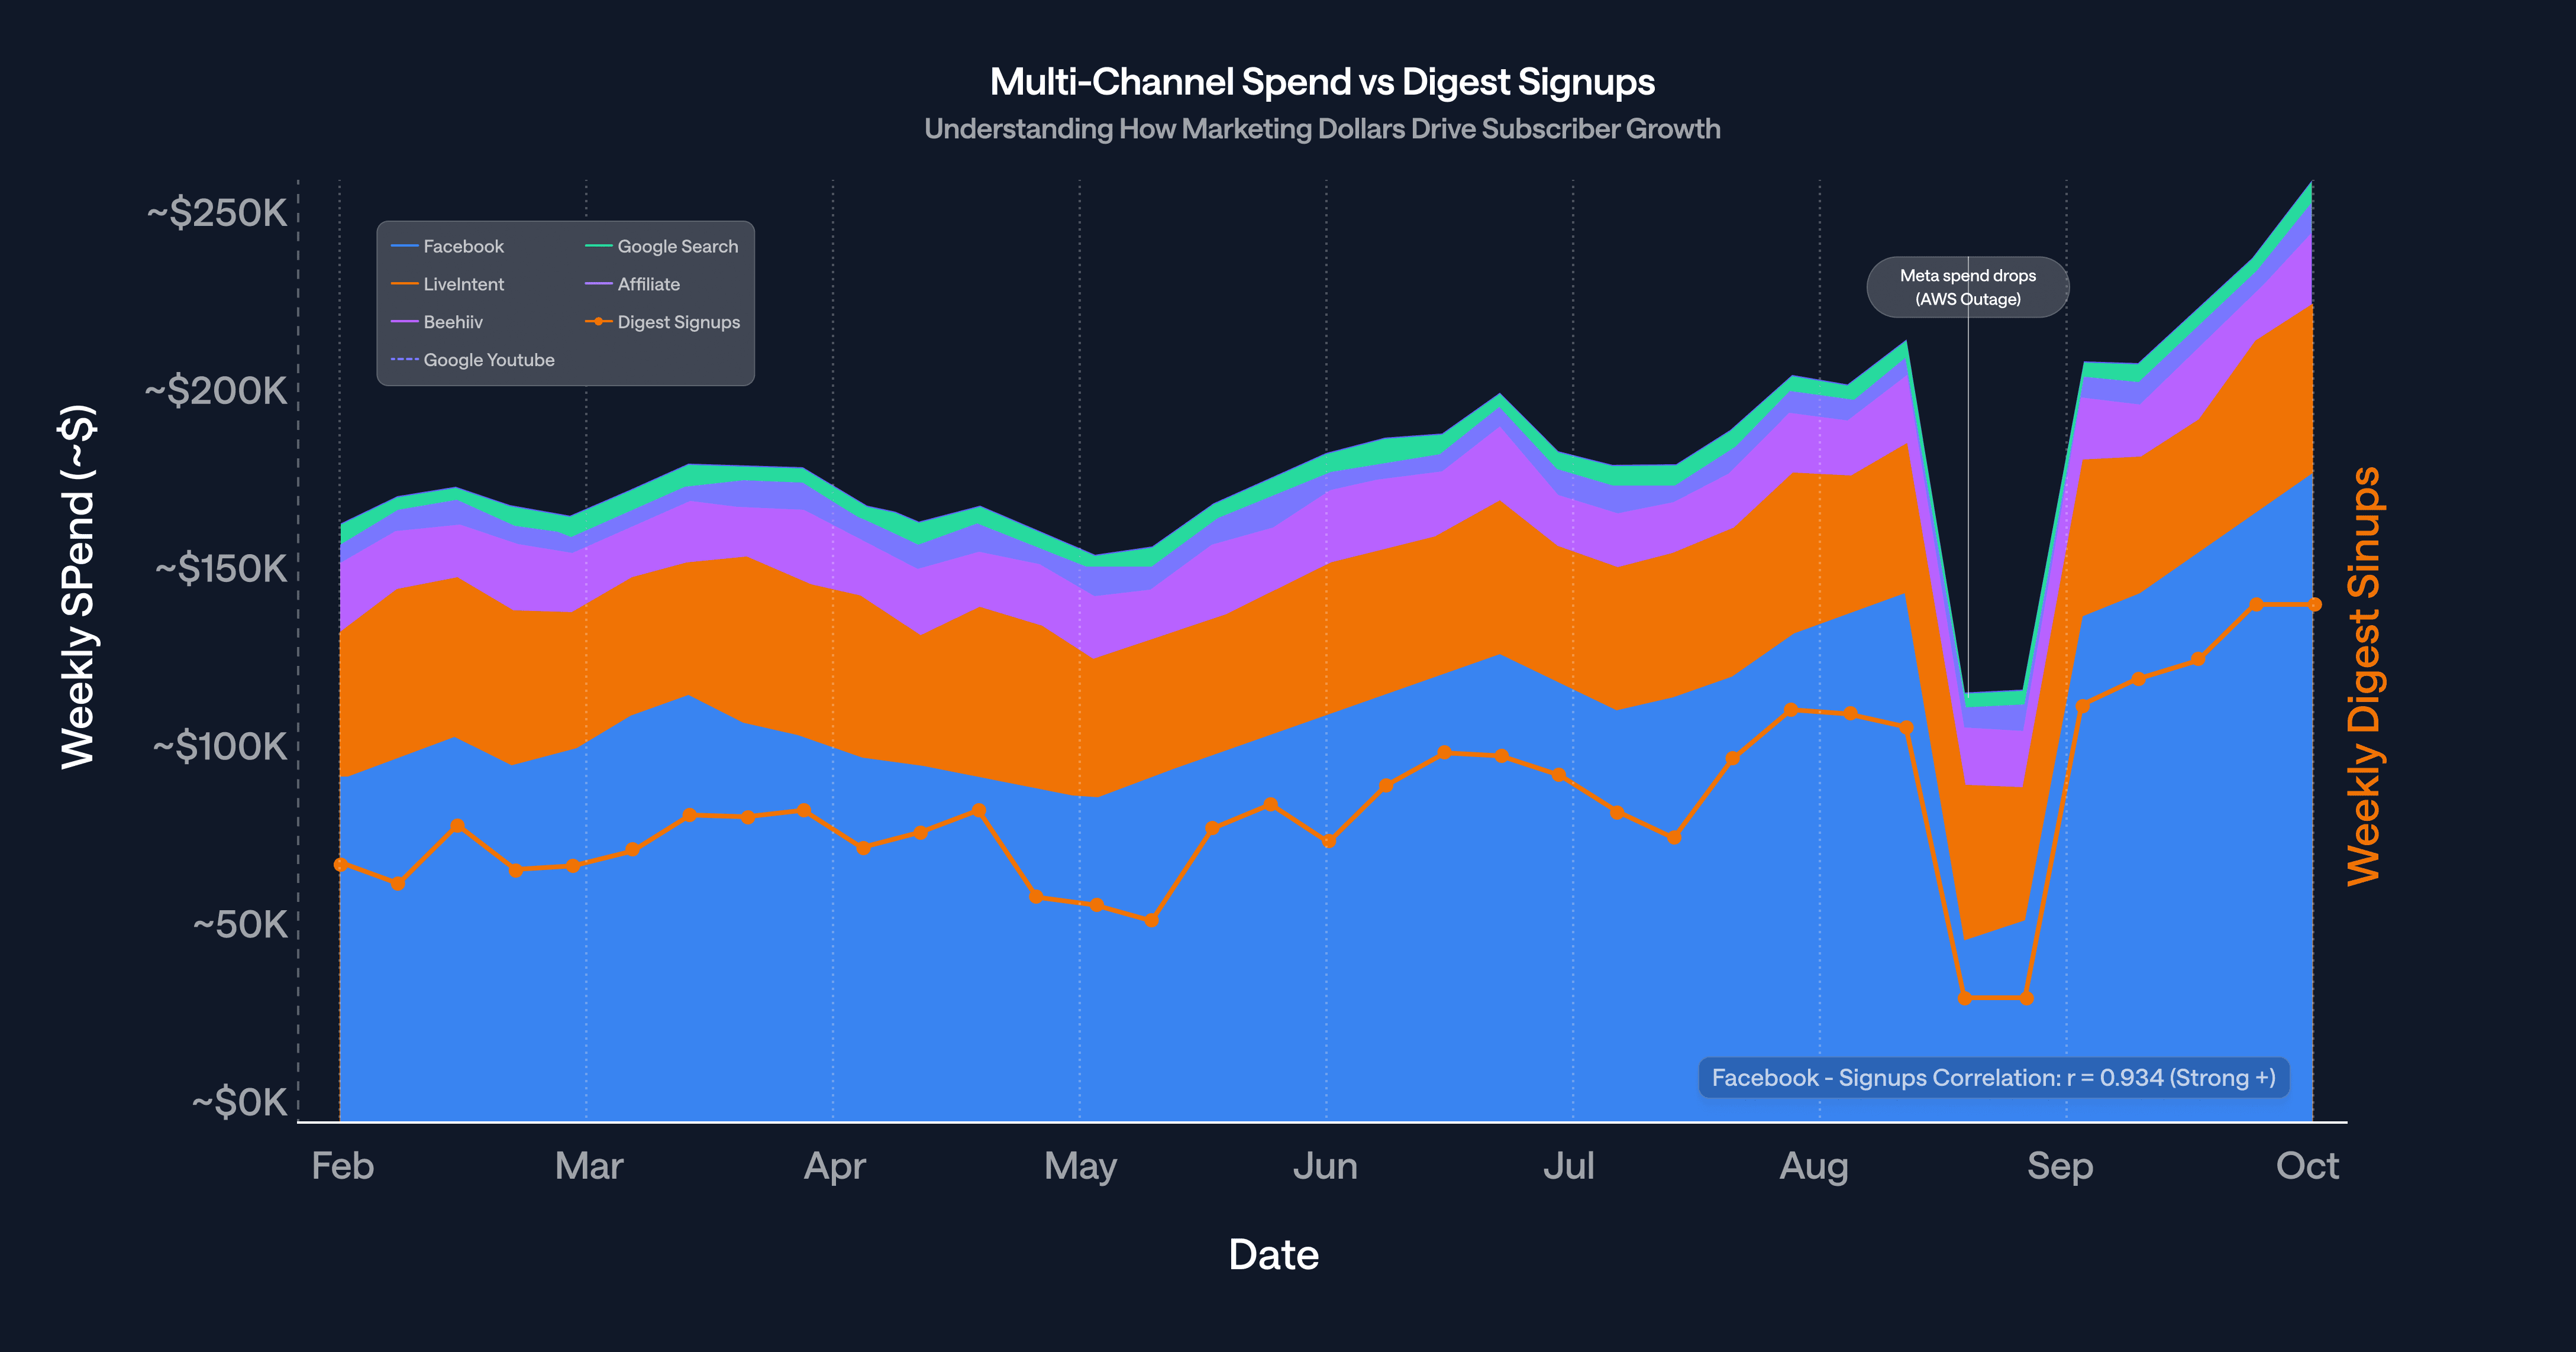
1440's weekly marketing spend by channel (Feb-Oct 2025). Note how digest signups track closely with Facebook spend changes while other channels remained relatively flat.
BlueAlpha's Approach
Phase 1: Data integration (August)
BlueAlpha connected paid media (Google Ads, Meta Ads, LiveIntent, beehiiv, X, Jeeng), GA4 digest signup events (filtered to Daily Digest only, excluding topic newsletter signups that had been confusing Meta's optimization algorithm), and Redshift payback tables showing revenue quality per subscriber by channel.

1440's complete data architecture (paid platforms, first-party analytics, and quality metrics) unified by BlueAlpha in a single measurement system.
Phase 2: Quality-adjusted Bayesian MMM (September)
The model was designed around 1440's specific economics. Raw subscriber counts tell half the story; what matters is revenue per digest by acquisition channel. BlueAlpha integrated payback rate data into the response curves, so each channel's contribution was weighted by both volume and subscriber quality. The model refreshed weekly, adapting to new data patterns and seasonal shifts (including 1440's "Q5 timeframe," their annual scaling window starting around December 27).
The first results presentation revealed a clear hierarchy of channel value adjusted for both volume and quality:
Channel | Raw CPA Rank | Quality-Adjusted Rank | Key Finding |
|---|---|---|---|
Meta (Facebook) | 1st (lowest CAC) | 1st (most incremental) | "Strong+" correlation with subscriber growth |
beehiiv | 5th | Rose notably | Significantly higher subscriber quality than Facebook |
LiveIntent | 3rd | Dropped significantly | Negative correlation with growth; payback period stretched to over 3 years vs. 1-year target |
Google campaigns | Mixed | Dropped after adjustment | PMax showed weak correlation, poor quality-adjusted performance |
Erika described why the quality adjustment mattered: "We talk about bringing on dud emails. You're bringing on a bunch of emails that don't open, don't click. Our first million and a half subscribers were really high quality. They're kind of like our power readers."
Phase 3: The accidental experiment (October)
During October, 1440's CEO directed the team to aggressively scale Facebook spend. Days later, an AWS outage took Facebook ads offline temporarily. When Meta went dark, subscriber growth dropped. When spend scaled back up, growth followed. This was not correlation in a spreadsheet; it was real-time causal evidence visible in the weekly model.
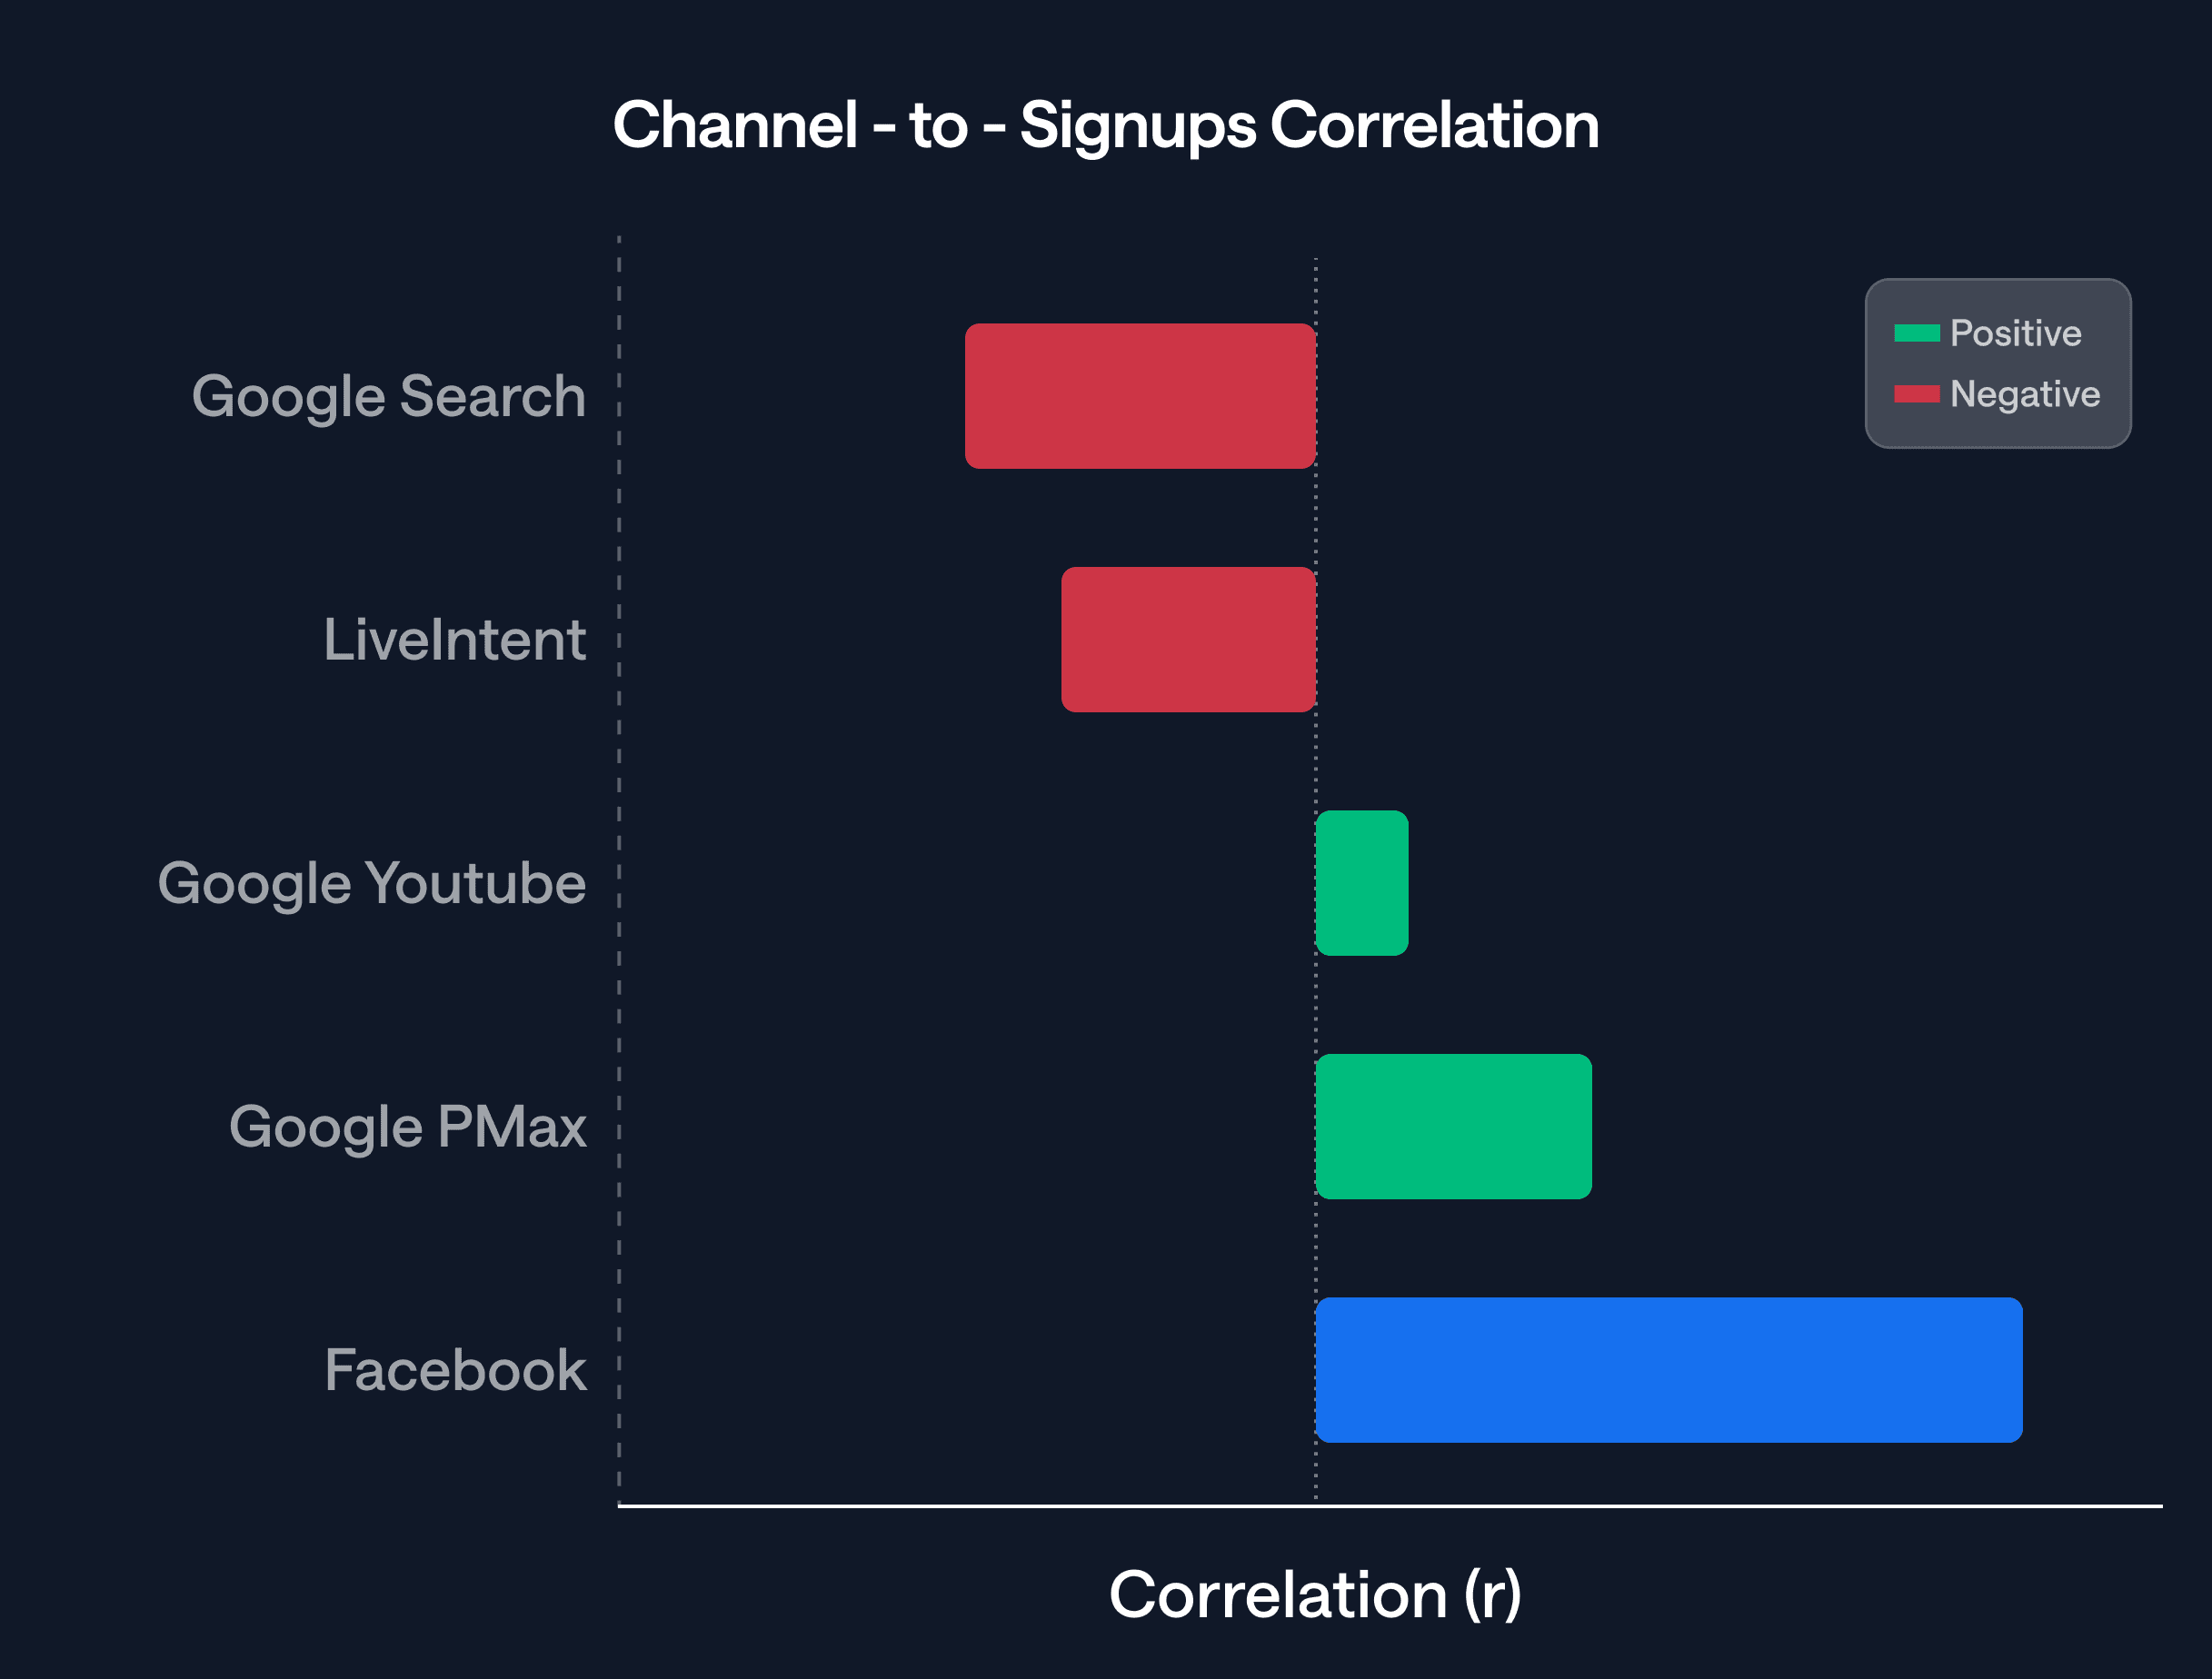
The 13-week spend-to-outcome analysis showed Facebook's correlation classified as "Strong+" (the highest confidence level in BlueAlpha's framework), while LiveIntent showed a negative correlation.
Phase 4: Organic social integration (October)
BlueAlpha integrated YouTube, Facebook, X, and Instagram organic engagement data into the model. The impact was immediate: organic social accounted for approximately 20% of previously unexplained baseline, and roughly 15% of conversions previously credited to Meta ads were correctly reattributed to organic social activity. For the first time, 1440 could see paid and organic investment in the same measurement system.
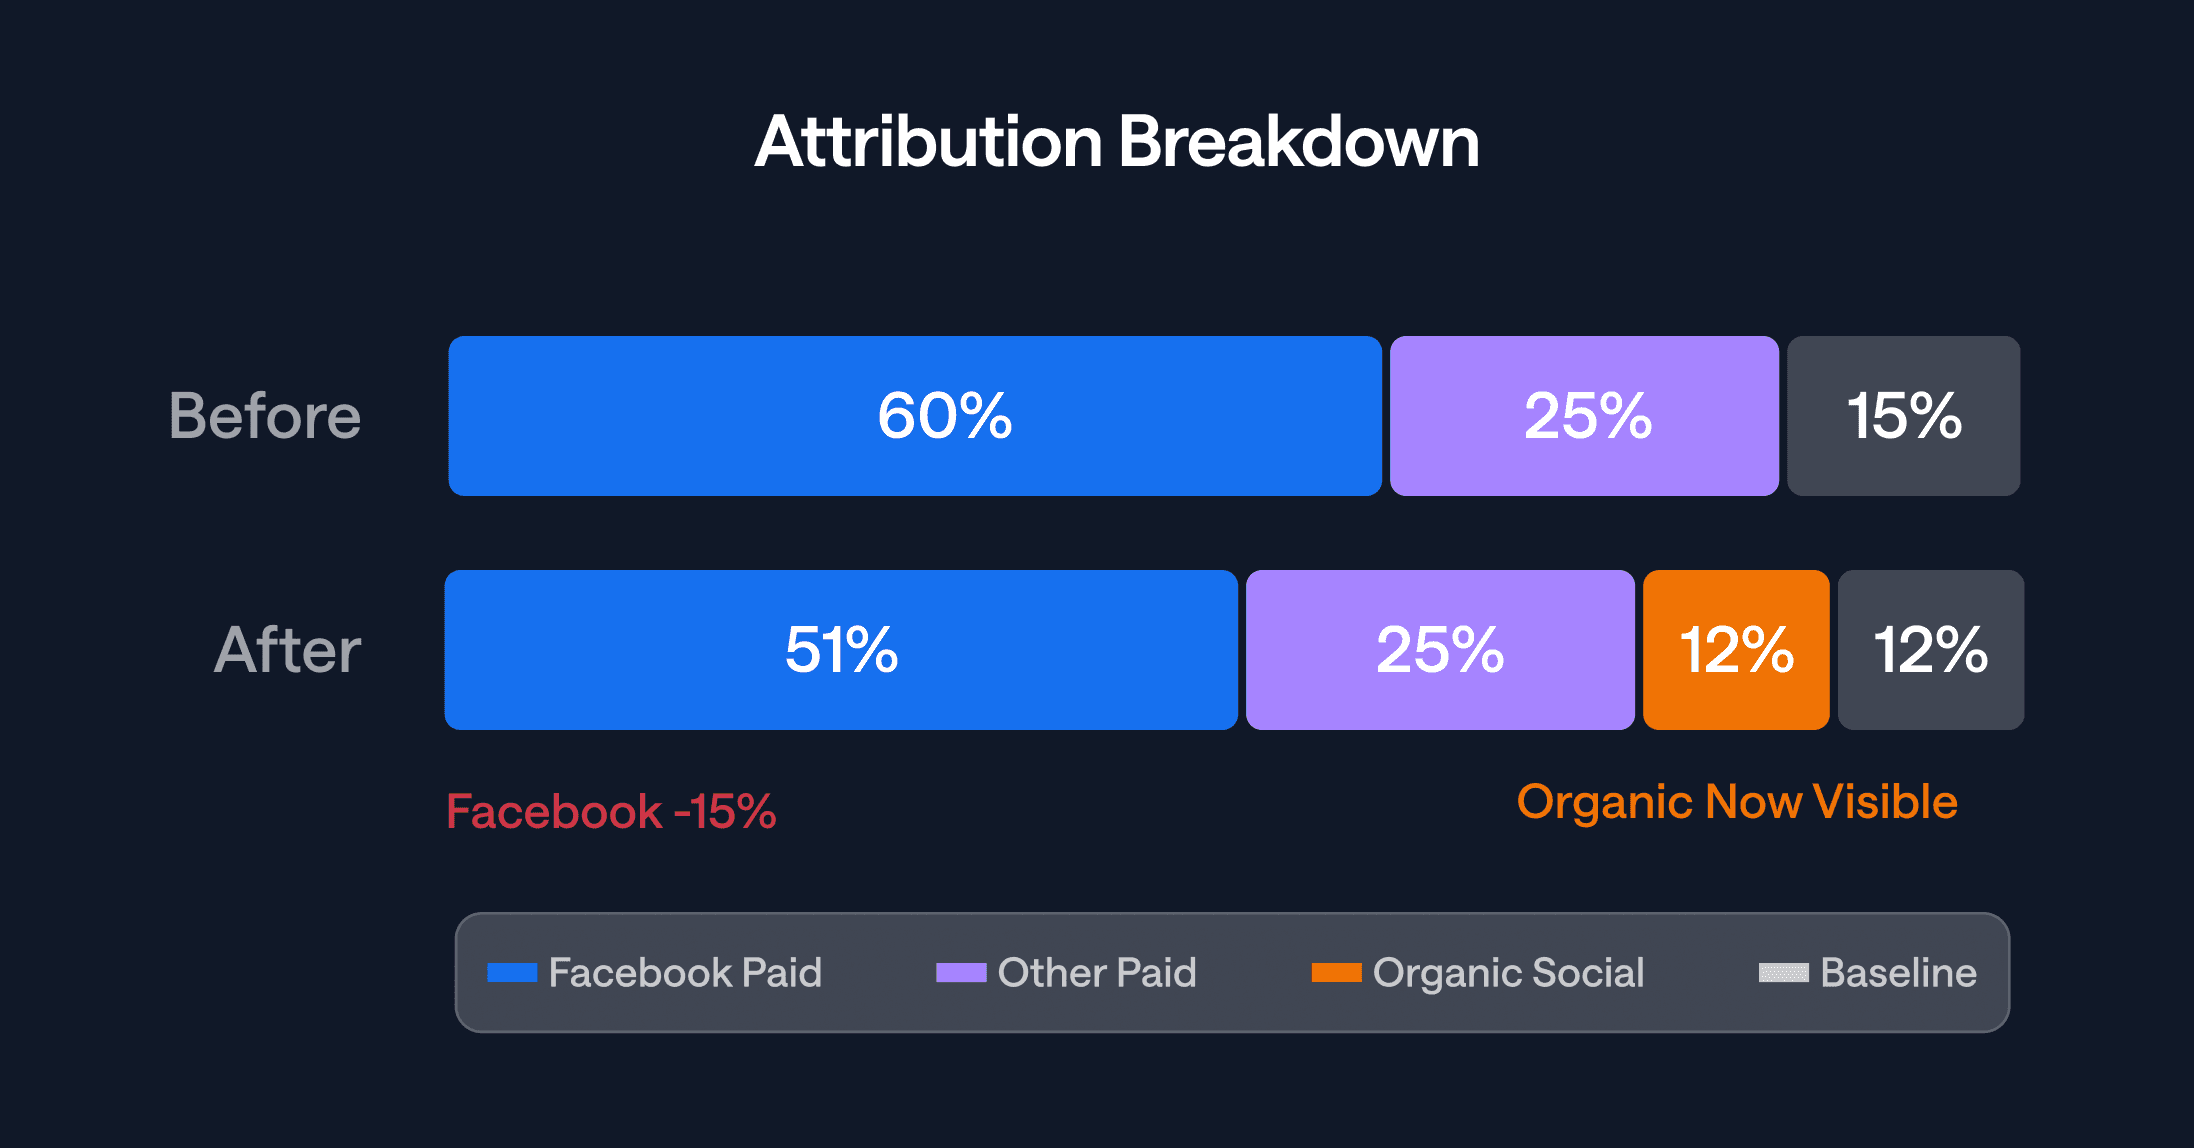
How adding organic social measurement changed 1440's attribution picture. ~15% of conversions previously credited to Facebook ads were correctly attributed to organic social efforts.
LiveIntent Killed, Meta Scaled to ~$650K/Month
LiveIntent eliminated (November 2025). The model showed negative correlation with digest signup growth and declining subscriber quality. Erika's own data confirmed: CPAs on LiveIntent had been rising sharply over the preceding months while quality went in the opposite direction, with payback stretching to over three years against a one-year target. The entire channel was shut down and budget moved to proven performers.
Meta scaled to ~$650K/month with conviction. The "Strong+" correlation, lowest quality-adjusted CAC, and the accidental holdout evidence gave 1440 the data to continue scaling Meta with board-level confidence. Erika described the shift: "I always trust the model first. And then platform. That goes for all channels."
Google PMax eliminated. Weak correlation and poor quality-adjusted performance led to a full shutdown. Google Search continued where the economics held.
Organic social quantified. For the first time, 1440 could measure that roughly 20% of subscriber growth came from organic content efforts. This shifted budget conversations from "organic is unmeasurable" to "organic drives a quantifiable share of signups, and here's how paid and organic interact."
Weekly decision cadence established. The MMM refreshed every week. Erika described how this changed operations: "I use the MMM to help me plan where budgets should allocate by channel." Office hours with BlueAlpha became 25-minute weekly check-ins to review model updates, discuss anomalies, and plan tests.
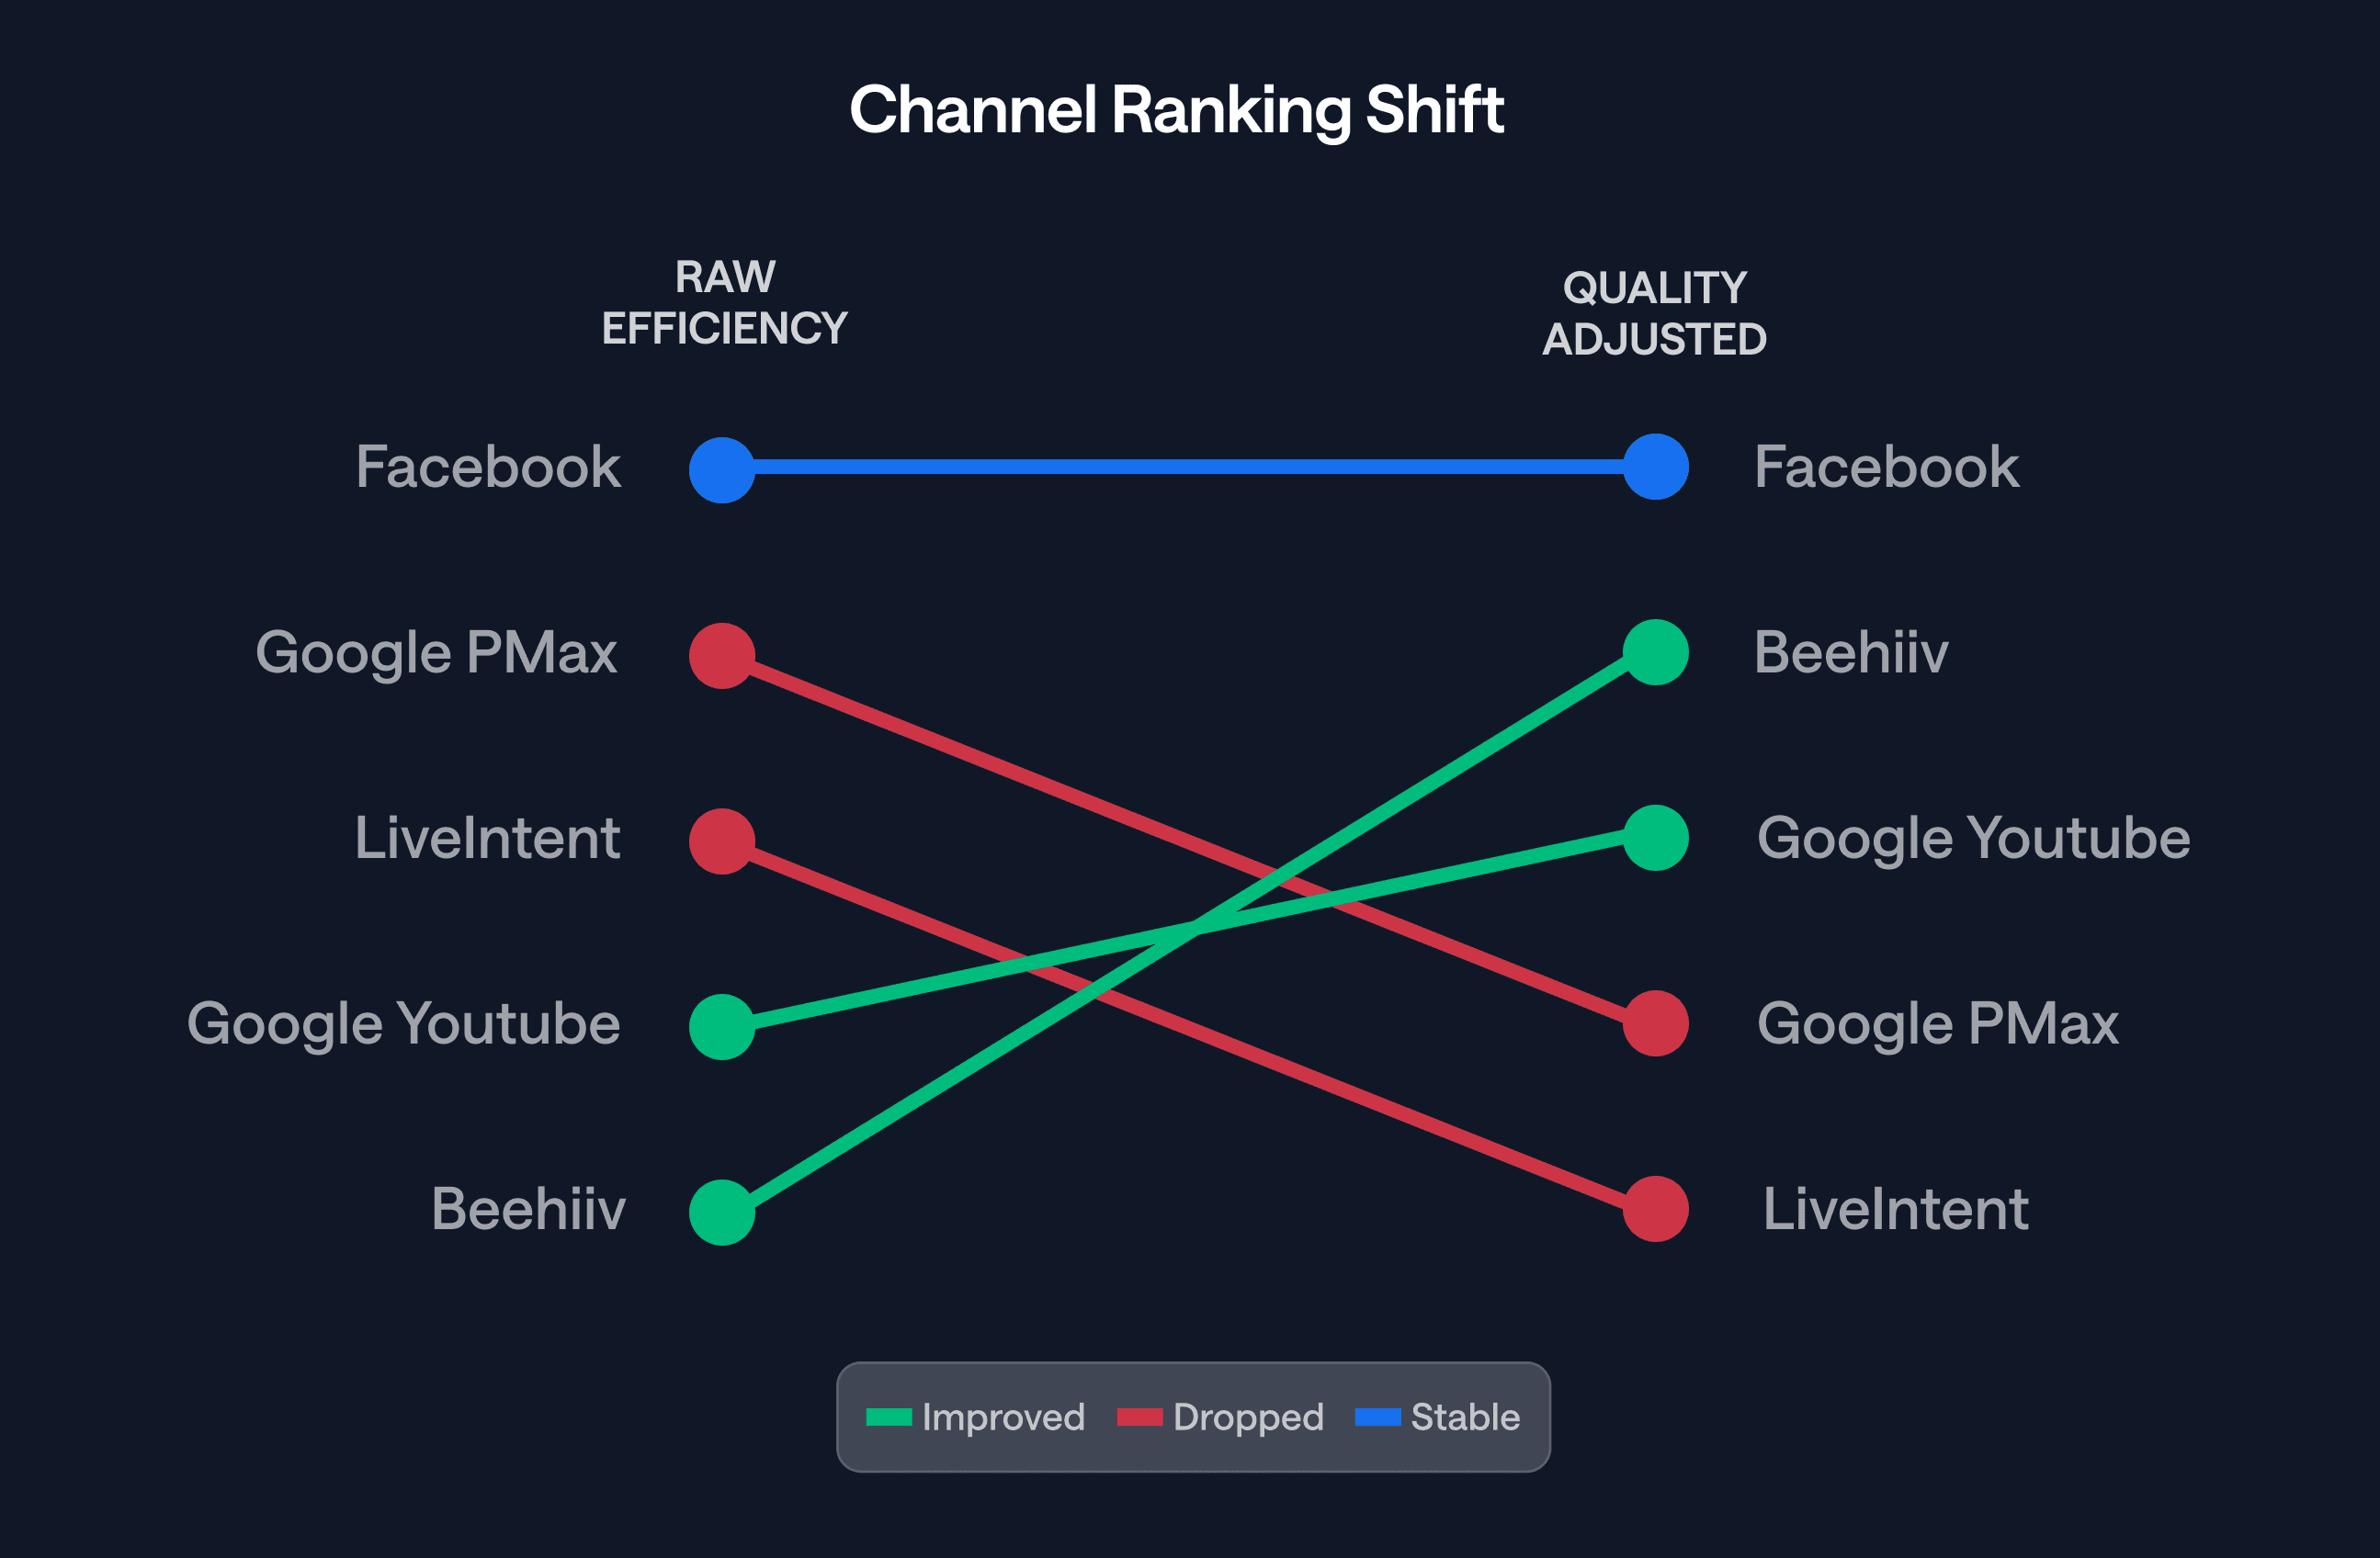
Before and after quality adjustment: LiveIntent and Beehiiv improved notably in incremental value, while Google campaigns dropped.
Why Quality-Adjusted Weekly MMM Changed Everything
1. True Causal Measurement
BlueAlpha's Bayesian MMM doesn't just correlate - it identifies causation through spend variance analysis. When Facebook spend goes up and signups follow, then spend goes down and signups drop, the model captures that relationship with statistical rigor. The strong correlation isn't a guess - it's a probability-weighted measurement with uncertainty intervals.
2. Quality-First Economics
Most MMMs stop at "how many conversions?". BlueAlpha asks "how valuable are those conversions?". By integrating 1440's payback rate data directly into response curves, the system compares apples to apples. A channel might look efficient on raw CPA but terrible on revenue quality - or vice versa. 1440 now sees both dimensions simultaneously.
3. Weekly Refresh Velocity
Traditional MMMs are quarterly exercises. By the time insights reach decision-makers, market conditions have shifted. BlueAlpha's weekly updates meant 1440 could detect when Meta's new "value-based" algorithm started pushing higher-LTV cohorts - and respond immediately by increasing spend.
4. Organic Social Integration
Measuring organic has been marketing's white whale. BlueAlpha solved it by pulling engagement metrics from each organic platform and incorporating them as model variables. The result: organic social activities moved from "unmeasurable baseline" to "quantified channel contribution."
5. Radical Transparency
No black boxes. 1440's team can inspect priors, posteriors, diagnostics, and see exactly why a recommendation changed. When the model said "turn off LiveIntent," it wasn't blind faith - 1440 could trace the logic through correlation data, quality adjustments, and statistical confidence intervals.
Testing Roadmap: CTV, TikTok Spark Ads, YouTube Shorts
1440's testing roadmap expanded into new channels: CTV (top priority for upper-funnel expansion), TikTok Spark Ads (news content fits the platform naturally), YouTube Shorts, and Snapchat/Reddit as news-adjacent audiences. Quality metric refinement continued alongside systematic Meta scaling with ongoing monitoring for saturation signals. The organic social integration expanded with additional API connections.
Key Takeaways for Newsletter and Media Companies
1. Platform metrics lie by omission. Facebook's reported conversions may be real, but they don't tell you if those conversions would have happened anyway. Only incrementality measurement reveals true channel value.
2. Correlation strength matters. A strong (over 9.0) correlation isn't just "good" - it's actionable evidence that justifies major budget decisions. Weak correlations (under 0.5) should trigger scrutiny, not scaling.
3. Quality adjustments change everything. Raw CPA rankings often flip when subscriber quality is factored in. Measure revenue value, not just acquisition cost.
4. Organic social is measurable. The "unmeasurable" label is outdated. Modern MMMs can incorporate organic engagement data and attribute conversions appropriately.
5. Speed beats precision. A weekly model that's 85% accurate enables faster learning than a quarterly model that's 95% accurate. Iteration velocity compounds.
6. Trust unlocks action. The most sophisticated measurement means nothing if leadership doesn't believe it. BlueAlpha's transparent methodology builds the confidence required to make bold decisions.
Running a newsletter or media business and guessing which channels drive subscribers who actually engage? Book a strategy call to see how a quality-adjusted MMM separates real subscriber growth from list-inflating waste.

"Before BlueAlpha, our data was scattered, making it hard to clearly demonstrate impact. We believed Meta was working, but belief alone doesn’t secure the budget. Now I have a tool that shows exactly how everything’s performing — and that clarity is worth more than any dashboard."

Erika Burghardt Vice President of Growth at 1440
BlueAlpha built a weekly-refresh Bayesian MMM with quality-adjusted response curves for 1440, one of the largest daily news digests in the U.S. The model proved Meta as the primary growth driver (roughly 60% of total contribution, lowest CAC), revealed that LiveIntent had a negative correlation with digest signup growth despite consuming significant budget, and measured organic social contribution for the first time. 1440 used the results to scale Meta spend to approximately $650K per month, eliminate LiveIntent, and turn off underperforming Google PMax campaigns.
1440: 4M+ Subscribers, Payback Rate as North Star
1440 is a daily news digest reaching over 4 million subscribers at the time of the engagement, with a goal of 5 million. The marketing team, led by Erika Burghardt (VP of Growth), ran a multi-channel operation across Meta, LiveIntent, beehiiv, Google (Search, PMax, YouTube), and affiliate partnerships. The team tracked payback rates by channel (their North Star for subscriber quality: anything over 9% first-month payback is good, anything under gets flagged) and managed weekly ad budgets exceeding six figures on Meta alone.
As Erika described the starting position: "We believed Meta was working, but belief alone doesn't secure the budget. Now I have a tool that shows exactly how everything's performing."
Measuring Subscriber Quality by Channel at Scale
Erika called it "my biggest battle: finding the right mix of scalability at efficiency." The tension was specific to newsletter economics: advertiser revenue depends on engaged subscribers who open, click, and generate ad impressions. Acquiring cheap subscribers who never open degrades list quality and erodes advertiser confidence.
Erika described the pressure directly: "Some of our advertisers are like, 'Hey, you guys aren't growing as fast as you were. What's going on?' - but we don't want to bring on a bunch of low-quality subscribers just to say that we have 5 million and then it hurts us in the long run because they don't open, they don't click, and then we don't see that money in revenue."
The measurement gap compounded this tension. Platform reports, GA4, and internal models each told a different story. Meta claimed conversions. Google PMax claimed conversions. LiveIntent claimed conversions. But CAC kept rising and internal data showed quality declining on some channels. The team could not answer which channels were actually driving incremental digest signups vs. claiming credit for subscribers who would have signed up organically. As Erika put it: "I trust Google's in-platform metrics more than I trust Meta's," but neither source gave her a definitive answer.
A critical blind spot: 1440 posts roughly seven times per day across Instagram and Facebook, publishes weekly YouTube videos, and runs broadcast channels. None of this organic activity appeared in any measurement system. It was absorbed into "baseline" and ignored, which meant paid channels were likely getting credit for some organic-driven signups.

1440's weekly marketing spend by channel (Feb-Oct 2025). Note how digest signups track closely with Facebook spend changes while other channels remained relatively flat.
BlueAlpha's Approach
Phase 1: Data integration (August)
BlueAlpha connected paid media (Google Ads, Meta Ads, LiveIntent, beehiiv, X, Jeeng), GA4 digest signup events (filtered to Daily Digest only, excluding topic newsletter signups that had been confusing Meta's optimization algorithm), and Redshift payback tables showing revenue quality per subscriber by channel.

1440's complete data architecture (paid platforms, first-party analytics, and quality metrics) unified by BlueAlpha in a single measurement system.
Phase 2: Quality-adjusted Bayesian MMM (September)
The model was designed around 1440's specific economics. Raw subscriber counts tell half the story; what matters is revenue per digest by acquisition channel. BlueAlpha integrated payback rate data into the response curves, so each channel's contribution was weighted by both volume and subscriber quality. The model refreshed weekly, adapting to new data patterns and seasonal shifts (including 1440's "Q5 timeframe," their annual scaling window starting around December 27).
The first results presentation revealed a clear hierarchy of channel value adjusted for both volume and quality:
Channel | Raw CPA Rank | Quality-Adjusted Rank | Key Finding |
|---|---|---|---|
Meta (Facebook) | 1st (lowest CAC) | 1st (most incremental) | "Strong+" correlation with subscriber growth |
beehiiv | 5th | Rose notably | Significantly higher subscriber quality than Facebook |
LiveIntent | 3rd | Dropped significantly | Negative correlation with growth; payback period stretched to over 3 years vs. 1-year target |
Google campaigns | Mixed | Dropped after adjustment | PMax showed weak correlation, poor quality-adjusted performance |
Erika described why the quality adjustment mattered: "We talk about bringing on dud emails. You're bringing on a bunch of emails that don't open, don't click. Our first million and a half subscribers were really high quality. They're kind of like our power readers."
Phase 3: The accidental experiment (October)
During October, 1440's CEO directed the team to aggressively scale Facebook spend. Days later, an AWS outage took Facebook ads offline temporarily. When Meta went dark, subscriber growth dropped. When spend scaled back up, growth followed. This was not correlation in a spreadsheet; it was real-time causal evidence visible in the weekly model.

The 13-week spend-to-outcome analysis showed Facebook's correlation classified as "Strong+" (the highest confidence level in BlueAlpha's framework), while LiveIntent showed a negative correlation.
Phase 4: Organic social integration (October)
BlueAlpha integrated YouTube, Facebook, X, and Instagram organic engagement data into the model. The impact was immediate: organic social accounted for approximately 20% of previously unexplained baseline, and roughly 15% of conversions previously credited to Meta ads were correctly reattributed to organic social activity. For the first time, 1440 could see paid and organic investment in the same measurement system.

How adding organic social measurement changed 1440's attribution picture. ~15% of conversions previously credited to Facebook ads were correctly attributed to organic social efforts.
LiveIntent Killed, Meta Scaled to ~$650K/Month
LiveIntent eliminated (November 2025). The model showed negative correlation with digest signup growth and declining subscriber quality. Erika's own data confirmed: CPAs on LiveIntent had been rising sharply over the preceding months while quality went in the opposite direction, with payback stretching to over three years against a one-year target. The entire channel was shut down and budget moved to proven performers.
Meta scaled to ~$650K/month with conviction. The "Strong+" correlation, lowest quality-adjusted CAC, and the accidental holdout evidence gave 1440 the data to continue scaling Meta with board-level confidence. Erika described the shift: "I always trust the model first. And then platform. That goes for all channels."
Google PMax eliminated. Weak correlation and poor quality-adjusted performance led to a full shutdown. Google Search continued where the economics held.
Organic social quantified. For the first time, 1440 could measure that roughly 20% of subscriber growth came from organic content efforts. This shifted budget conversations from "organic is unmeasurable" to "organic drives a quantifiable share of signups, and here's how paid and organic interact."
Weekly decision cadence established. The MMM refreshed every week. Erika described how this changed operations: "I use the MMM to help me plan where budgets should allocate by channel." Office hours with BlueAlpha became 25-minute weekly check-ins to review model updates, discuss anomalies, and plan tests.

Before and after quality adjustment: LiveIntent and Beehiiv improved notably in incremental value, while Google campaigns dropped.
Why Quality-Adjusted Weekly MMM Changed Everything
1. True Causal Measurement
BlueAlpha's Bayesian MMM doesn't just correlate - it identifies causation through spend variance analysis. When Facebook spend goes up and signups follow, then spend goes down and signups drop, the model captures that relationship with statistical rigor. The strong correlation isn't a guess - it's a probability-weighted measurement with uncertainty intervals.
2. Quality-First Economics
Most MMMs stop at "how many conversions?". BlueAlpha asks "how valuable are those conversions?". By integrating 1440's payback rate data directly into response curves, the system compares apples to apples. A channel might look efficient on raw CPA but terrible on revenue quality - or vice versa. 1440 now sees both dimensions simultaneously.
3. Weekly Refresh Velocity
Traditional MMMs are quarterly exercises. By the time insights reach decision-makers, market conditions have shifted. BlueAlpha's weekly updates meant 1440 could detect when Meta's new "value-based" algorithm started pushing higher-LTV cohorts - and respond immediately by increasing spend.
4. Organic Social Integration
Measuring organic has been marketing's white whale. BlueAlpha solved it by pulling engagement metrics from each organic platform and incorporating them as model variables. The result: organic social activities moved from "unmeasurable baseline" to "quantified channel contribution."
5. Radical Transparency
No black boxes. 1440's team can inspect priors, posteriors, diagnostics, and see exactly why a recommendation changed. When the model said "turn off LiveIntent," it wasn't blind faith - 1440 could trace the logic through correlation data, quality adjustments, and statistical confidence intervals.
Testing Roadmap: CTV, TikTok Spark Ads, YouTube Shorts
1440's testing roadmap expanded into new channels: CTV (top priority for upper-funnel expansion), TikTok Spark Ads (news content fits the platform naturally), YouTube Shorts, and Snapchat/Reddit as news-adjacent audiences. Quality metric refinement continued alongside systematic Meta scaling with ongoing monitoring for saturation signals. The organic social integration expanded with additional API connections.
Key Takeaways for Newsletter and Media Companies
1. Platform metrics lie by omission. Facebook's reported conversions may be real, but they don't tell you if those conversions would have happened anyway. Only incrementality measurement reveals true channel value.
2. Correlation strength matters. A strong (over 9.0) correlation isn't just "good" - it's actionable evidence that justifies major budget decisions. Weak correlations (under 0.5) should trigger scrutiny, not scaling.
3. Quality adjustments change everything. Raw CPA rankings often flip when subscriber quality is factored in. Measure revenue value, not just acquisition cost.
4. Organic social is measurable. The "unmeasurable" label is outdated. Modern MMMs can incorporate organic engagement data and attribute conversions appropriately.
5. Speed beats precision. A weekly model that's 85% accurate enables faster learning than a quarterly model that's 95% accurate. Iteration velocity compounds.
6. Trust unlocks action. The most sophisticated measurement means nothing if leadership doesn't believe it. BlueAlpha's transparent methodology builds the confidence required to make bold decisions.
Running a newsletter or media business and guessing which channels drive subscribers who actually engage? Book a strategy call to see how a quality-adjusted MMM separates real subscriber growth from list-inflating waste.
